Geoscience Reference
In-Depth Information
(A)
80
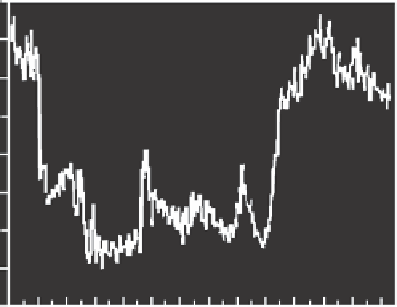
Fiber Optic Fluorometer
EM = 361 nm
70
60
50
40
30
20
10
0
2
4
6
8
10
121416
1820222426
80
Flow Through Fluorometer
EM = 360 nm
70
60
50
40
30
20
10
0
2
4
6
8
10
121416
1820222426
Hours
Figure 6.4.
(A)
Comparison of fiber-optic and flow-through methods for DOM fluorescence measure-
ments. (Redrawn from Lieberman et al.,
1992
.)
(B)
Comparison of ZAPS (Klinkhammer,
1994
) with
discrete samples. (Redrawn from Chen and Bada,
1992
.)
fluorometer was found with discrete samples taken in the NE Pacific (
Figure 6.4B
) (Chen
and Bada,
1992
). Work demonstrated that
in situ
profiles overcame uncertainties associated
with preservation and filtration for deep ocean samples.
Sensor development by the mid-1990s saw an emphasis on multispectral and hyperspec-
tral fluorometers. Heuermann et al. in
1995
reported on a new submersible instrument (ME
Meerestechnik-Elektronik GmbH, Schleswig-Holstein, Germany) designed to measure at
three excitation and nine emission wavelengths for CDOM, protein, and pigments. By
employing multiple bands, fluorescence properties of two algal cultures could be discerned
including 2 (short and long wavelength) humic bands (
Figure 6.5
). This unique instrument
even included a spectral band to record the Raman peak. Shortly after, Desiderio et al. in
1997
published on the development of a fluorometer that could measure at 6 excitation and