Geoscience Reference
In-Depth Information
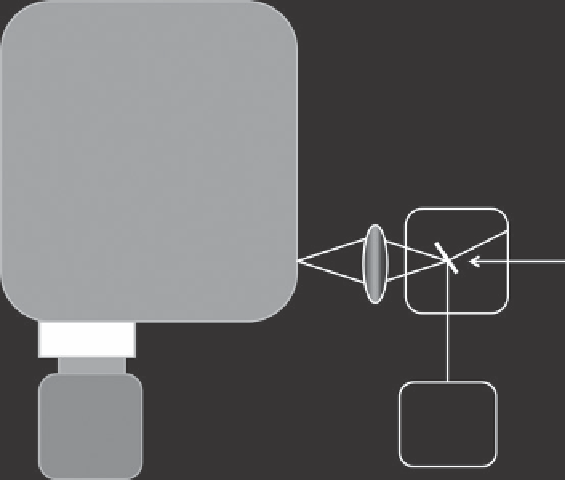
Emission
Monochromator
Vacuum Chamber
Sample
Lens
Charge-
Coupled
Device
(cooled)
Excitation
Source
Figure 5.4. Typical arrangement of an optical emission spectrometer.
where
n
i
is the total atom density,
k
is Boltzmann's constant,
T
is the absolute temperature,
and
g
i
is the statistical weight for state
i
. The frequency of the radiative emission corres-
ponds to the difference in energy levels of the excited analyte.
Alkali metals such as sodium and potassium have excited levels close to their ground
states and, as such, are relatively easy to excite using flames. Such atoms have resonance
lines generally in the visible and near-infrared (IR) regions of the spectrum. The product
of the excitation cross section as a function of both energy and the energy distribution of
the exciting source is important, as transitions may involve energy levels other than just
the ground and one excited level. As such, many other elements have energy levels signif-
icantly farther from their ground states and require considerably more intense excitation
from sources such as plasmas to generate a suitable emission signal. Owing to the high
energy difference between higher and lower energy states, such elements generally exhibit
emission spectra in the ultraviolet (UV).
The radiant emissive power,
φ
E
, from state
j
to
i
is given by: (5.4)
φ
=
Ah
ν
n
(5.4)
E
ji
ji i
where
A
ji
is the transitions probability,
h
j
ν
is the energy of the emitted photon, and
n
j
is the
number density of the higher energy state
j
.
For a system that is in thermal equilibrium, the radiant power of the emission is directly
related to the population densities of the excited states and hence to the analyte concentration

