Geoscience Reference
In-Depth Information
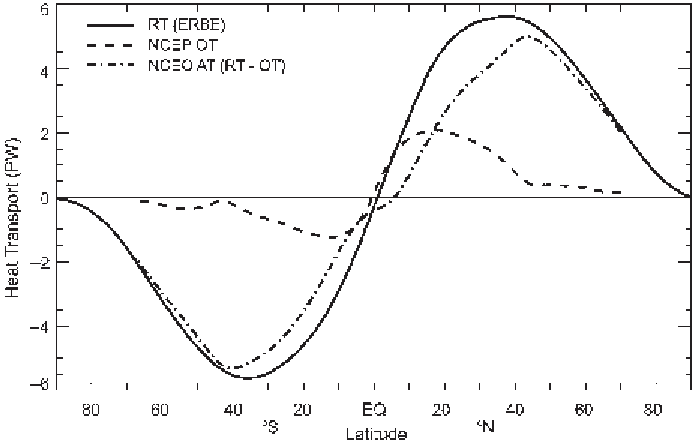
Figure 3.3.
Zonal averages (averages by latitude) from the ERBE period of the mean
annual energy transport required by the net radiation budget at the top of the atmosphere
(RT), the total atmospheric transport (AT), and the ocean transport (OT). Units are
petawatts (PW) (from Trenberth and Caron,
2001
, by permission of AMS).
depending on the latitude. The temperature gradient between the equator and poles
is therefore strongest, as is the poleward atmospheric transport. During summer,
the solar declination is positive, and there is a more even latitudinal distribution of
solar heating. This weakens the atmospheric temperature gradient, and the poleward
atmospheric transport is correspondingly smaller (
Figure 3.4
).
3.2
The Terms of the Arctic Energy Budget
3.2.1
Overview
With the basic role of the Arctic in the global climate system established, focus
turns to the energetics of the Arctic itself. Following the framework of past stud-
ies (Nakamura and Oort,
1988
; Overland and Turet,
1994
; Serreze et al.,
2007
) we
consider the annual cycle of the energy budget of the Arctic atmosphere, viewed in
terms of a column extending from the surface to the top of the atmosphere, and its
connection with the energy budget of the underlying column, extending from the
surface downward to a depth at which energy transfers can be assumed to be negli-
gible.
Figure 3.5
provides a schematic. After introducing the budget equations, we
examine the situation for both a simplified polar cap, extending from 70-90°N, and
for a domain representing the Arctic Ocean (
Figure 3.6
).