Geoscience Reference
In-Depth Information
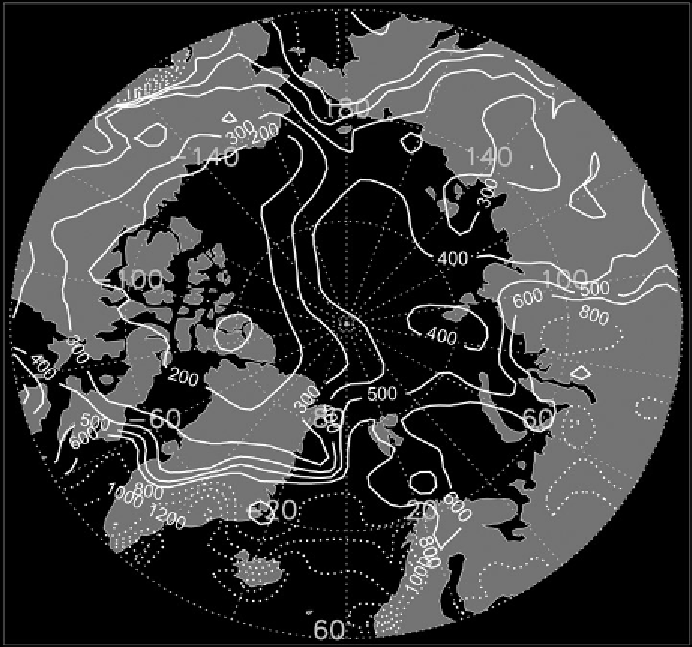
Figure 2.28.
Mean annual precipitation (mm) based on available bias-adjusted data
sources. Contour intervals are 100 mm (solid, for amounts up to 600 mm) and 200 mm
(dotted, for amounts 800 mm and greater) (by the authors).
controversial, although observed increases in the discharge of Eurasian river drain-
ing into the Arctic indicates that it has, which is supported by recent work pointing
to increases in net atmospheric vapor transport over the Eurasian drainages (Zhang
et al.,
2012
). The issue ultimately boils down to a problem of detection using either
sparse surface observations or data from satellite retrievals and atmospheric reanal-
yses, all of which have considerable sources of uncertainty.
2.3.8
Wind regime
Winds are relatively light in the central Arctic with mean annual speeds averaging
4-6 m s
−1
. The NP observations show mean speeds of about 5 m s
−1
year round. At
locations in Severnaya Zemlya and Franz Josef Land, mean monthly wind speeds
are only 6-7 m s
−1
in January (Borisov,
1975
). In the Barents-Kara sea sector,
cyclonic disturbances in winter bring higher wind speeds. The highest frequencies
of strong winds (>11 m s
−1
) in winter are reported in the Barents Sea (>40 percent),