Geoscience Reference
In-Depth Information
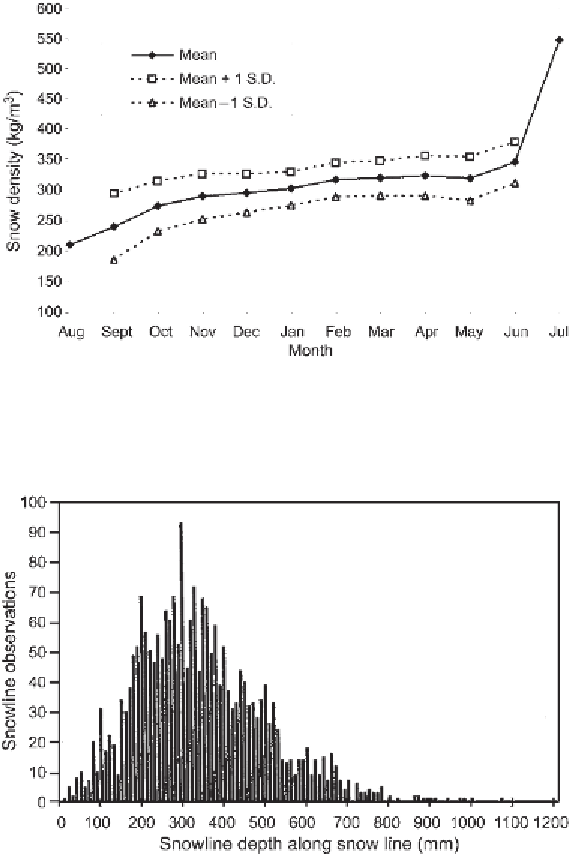
Figure 2.22.
Mean annual cycle of snow density (kg m
−3
) and +/−1 standard deviation
over the central Arctic Ocean based on NP data (from Colony et al.,
1998
, by permission
of Cambridge University Press).
Figure 2.23.
Distribution of snow depth (mm) over the central Arctic Ocean for April
from NP data (from Colony et al.,
1998
, by permission of Cambridge University
Press).
observed as a rapid decline in depth between June and July to a minimum of about
50 mm in August. The standard deviation of snow depth is fairly large and naturally
increases with mean snow depth. This represents both spatial and year-to-year var-
iability. During April, snow depths range from near zero to more than 1,000 mm,
pointing to drifting and wind scour. As the snowlines are over flat ice, the standard
deviation in snow depth is lower than would be obtained for regional averages that
include rough ice. Considering the mean snow density and depth, the average water