Geoscience Reference
In-Depth Information
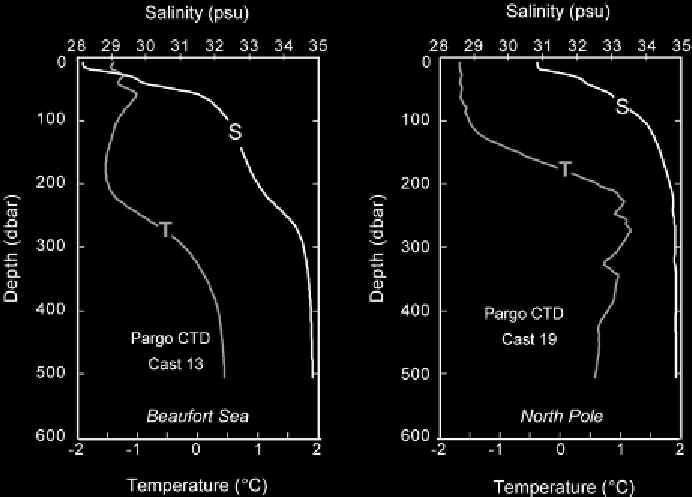
Figure 2.7.
Temperature and salinity profiles for the Beaufort Sea and near the
North Pole. The y-axis is depth in decibars (dbar), which closely approximates depth
in meters (courtesy of J. Morison, Polar Science Center, University of Washington,
Seattle, WA).
2.1.3
Physical Oceanography
Figure 2.7
shows typical vertical profiles of temperature and salinity for the Beaufort
Sea (north of Alaska, see
Figure 2.2
) and near the North Pole, collected during the
August-September 1993 cruise of the submarine
USS Pargo
. Although the two pro-
files show some obvious differences, which will be addressed shortly, several com-
mon features stand out. Note first the existence of a low salinity surface layer. In
these two examples, surface salinities are about 28 psu (Beaufort Sea) and 31 psu
(near the Pole). Standard ocean water is around 35 psu. Temperatures in the surface
layer are near the salinity-adjusted freezing point (salt in solution depresses the
freezing point to below 0°C). The region below the surface layer, extending to about
200-300 m depth is characterized by a rapid increase in salinity. This is attended by
an increase in temperature to maximum (and above-freezing) values at around 300-
500 m depth. Although temperature falls off at greater water depths, from about 400
m downward (not shown) salinity stays fairly uniform at 34.5-35.0 psu.
The layer of rapid salinity increase is termed a “halocline.” The layer of rapid
temperature increase in termed a “thermocline.” Over most of the global ocean,
a stable upper-ocean stratification (less dense water at the top) is maintained by
higher water temperatures closer to the surface. However, at the low water tem-
peratures found in the Arctic Ocean, the density stratification is determined not by