Geoscience Reference
In-Depth Information
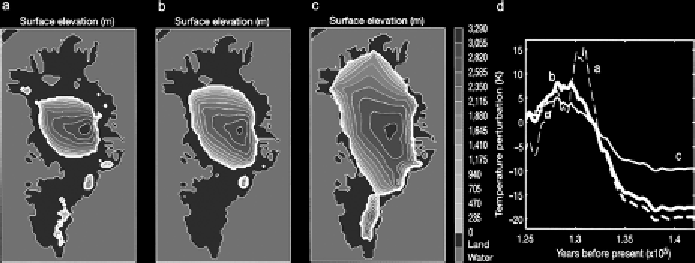
Figure 10.3.
Modeled extent and elevation of the Greenland ice sheet during the
Eemian interglacial (a-c) under three different temperature reconstructions (d) based
on the GRIP ice core records (adapted from Cuffey and Marshall,
2000
, by permission
of Nature).
Kukla et al. (
2002a
) identify the Eemian with widespread temperate mixed forest
cover in Europe and temperatures comparable with the present day or even higher.
In January, mean temperatures were 2-3
o
C higher than now in northwestern Russia
and 12
o
C higher in the lower Lena River basin. In the central Siberian Arctic coastal
area, July temperatures were 4-8
o
C warmer than now and the frost-free season
was up to 50 percent longer. The Greenland Ice Sheet was reduced in size com-
pared to day, but how much smaller is still unclear. Modeling studies suggest that
is may have lost 30-60 percent of its volume. At the peak of the Eemian, global sea
level appears to have been 4-7 m higher than today, with the mass loss from the
Greenland Ice Sheet contributing to anywhere from 2.2-4.5 m of sea level rise (van
Den Berg et al.,
2011
).
Figure 10.3
illustrates the modeled extent and elevation of
the Greenland Ice Sheet during the Eemian by K. Cuffey and S. Marshall (
2000
), on
the basis of three different interglacial temperature reconstructions. Although it has
long been recognized from ice core data that there was significant melt of the sheet
during the Eemian (e.g., Koerner,
1989
), analysis of the new NEEM ice core points
to a fairly modest decrease in surface elevation ice the ice sheet, arguing for modest
2 m contribution to sea level. This indicates that Antarctica must have contributed
strongly to the total Eemian sea level rise (NEEM community members,
2013
).
As is evident from
Figure 10.2
, the Eemian interglacial was followed by a cold
glacial, which was itself characterized by fluctuations between periods of exten-
sive ice (stades) and less extensive ice (interstades). During about 90 percent of the
last glacial cycle, global temperatures were substantially lower than those of the
Holocene. Temperatures in northern middle and high latitudes dropped in a series of
steps between MIS 5 and 2. Ice cover began to build up in northern North America,
Scandinavia and the Arctic Archipelagos around 110 ka. Major ice sheets were pre-
sent over northern North America, and Fennoscandinavia by about 90 ka but their
extent is poorly known. In northern Europe and northwest Russia, four glacial sta-
des are apparent within the last glaciation. Recent work in northern Russia indicates