Geoscience Reference
In-Depth Information
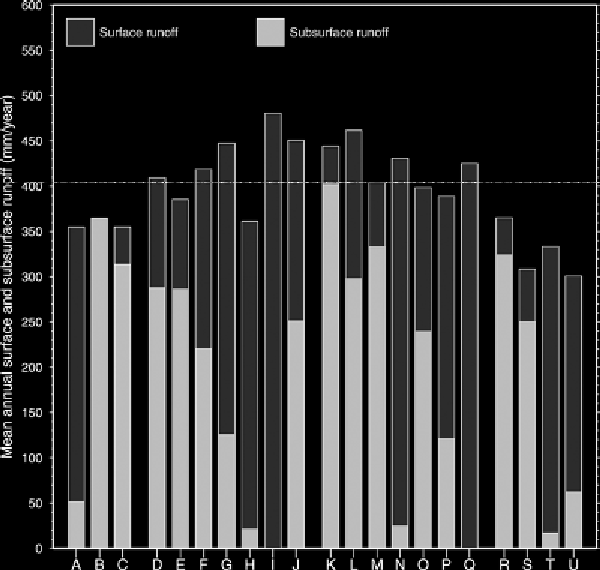
Figure 9.7.
Total basin mean annual surface and subsurface runoff from the twenty-one
PILPS 2e land surface models (listed as a-u) over the 1989-1998 period. The dashed
horizontal line is the observed mean annual runoff at the mouths of the Torne and Kalix
rivers combined (from Bowling et al.,
2003
, by permission of Elsevier).
mean evapotranspiration from each model for the four major Arctic-raining water-
sheds. Even though all of the models correctly capture the summer maximum and
winter minimum in evapotranspiration, there are large differences for every month.
As overall, VIC, has the highest runoff values of the five models, it follows natu-
rally that it has the lowest overall ET. However, because VIC has been calibrated to
observed discharge, for long-term annual means, its evapotranspiration is arguably
closer to the truth.
9.4
Sea Ice and Ice-Ocean Models
The first robust thermodynamic sea ice model was developed by Maykut and N.
Untersteiner (
1971
). This one-dimensional model passes heat fluxes from the atmo-
sphere and ocean into the ice and overlying snow cover snow by conduction. The
temperature of the snow (or air-ice) interface is determined by the surface energy
balance. The balance at the ice-ocean interface determines the melt/freeze state at
the sea ice bottom. The first successful three-dimensional dynamic-thermodynamic