Geoscience Reference
In-Depth Information
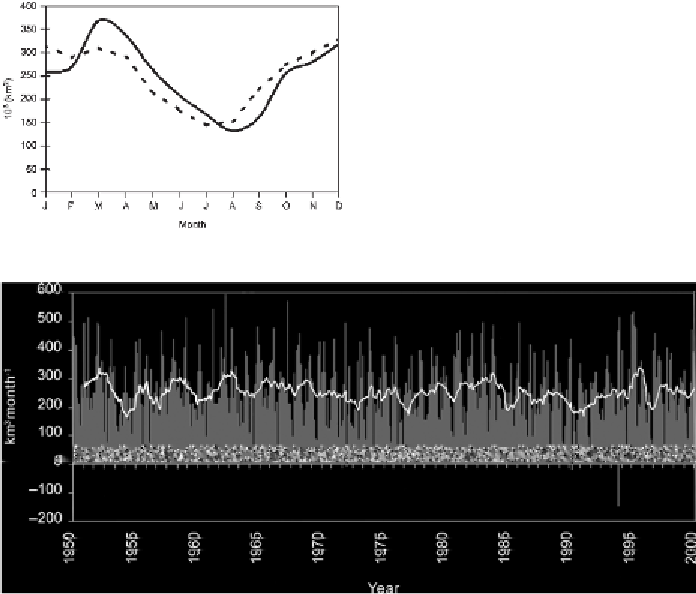
Figure 7.21.
Mean annual cycle of the ice
volume flux through the Fram Strait. The dotted
line shows the 1950-2000 parameterized mean
monthly flux. The solid line shows the volume
flux adjusted for the mean ice thickness
observed from 1990-1996 using upward-
looking sonar (from Vinje,
2001
, by permission
of AMS).
Figure 7.22.
Time series of the parameterized monthly ice volume flux through the
Fram Strait (grey columns) and the twelve-month running mean (black line) (from
Vinje,
2001
, by permission of AMS).
(
Figure 7.22
) is the large variability. Although there are no obvious long-term trends
in
Figure 7.17
, other investigators have noted a trend in either the volume or area
fluxes from the late 1970s through much of the 1990s (e.g., Kwok and Rothrock,
1999
), which can be related to the shift in the NAO/AO that has been discussed
previously. Kwok et al. (
2004
) cite a squared correlation between the winter Fram
Strait ice area outflow and the NAO index of 0.62.
7.5.2
The THC - Basic Considerations
Ocean transports act along with atmosphere transports to convey heat from low to
high latitudes (
Chapter 3
). Much of the oceanic heat transport is associated with
the global thermohaline circulation (THC). The THC, also referred to as the Great
Ocean Conveyer (and similar names), is the ocean circulation driven by horizontal
and vertical gradients in ocean salinity and temperature (hence density gradients).
In the northern North Atlantic, there is an intense winter heat loss from the ocean to
the atmosphere. Cooling of the water causes its density to increase. This cool water
sinks, causing deep water (North Atlantic Deep Water, or NADW) to be formed