Geoscience Reference
In-Depth Information
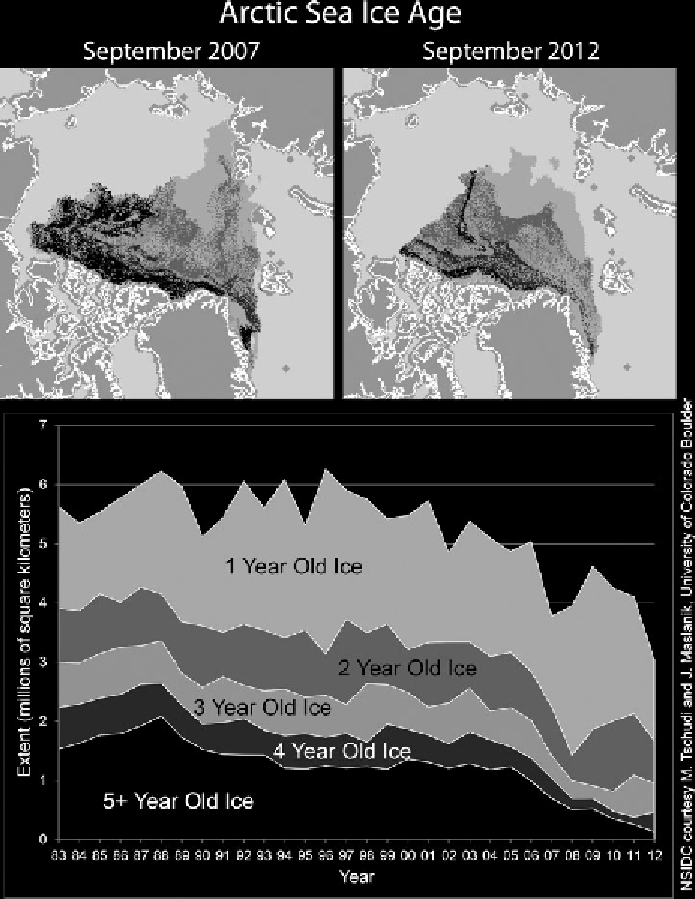
Figure 7.4.
Ice age based on a tracking algorithm applied to satellite data. The top
panel shows the spatial pattern of ice age classes for September 2012 and September
2007; the bottom panel shows the time history of September age classes for the Arctic
Ocean as a whole back to 1983 (from NSIDC, courtesy of J. Maslanik and M. Tschudi,
University of Colorado Boulder). (See plate section for color version.)
where H is ice thickness and θ is freezing degree days (°C per day). While formu-
lae given by these investigators were developed for ice in different locations, with
differing climate and snowfall conditions, the results over an ice thickness range of
0-100 cm are rather similar.