Geoscience Reference
In-Depth Information
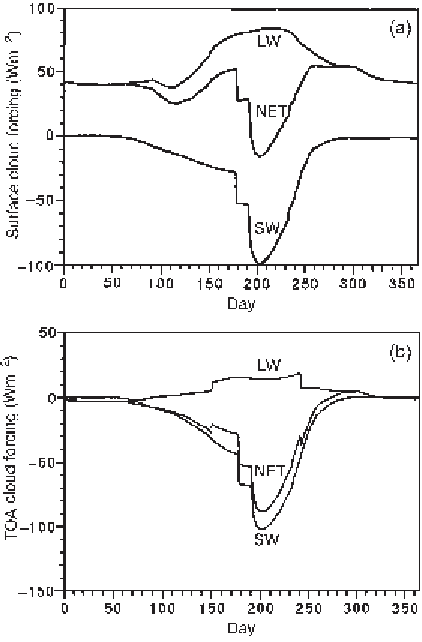
Figure 5.9.
Modeled annual
cycle of (a) the surface (b)
TOA cloud radiative forcing
(shortwave, longwave and net)
at 80°N (from Curry and Ebert,
1992
, by permission of AMS).
5.7.2
Fields of the Net Cloud Radiative
Forcing at the Surface
Fields for the four mid-season months from ISCCP-D appear in
Figure 5.10
. The
ISCCP-D data indicate that the cloud radiative forcing is positive for all of the Arctic
from October through March. It turns negative over the Atlantic side of the Arctic in
April. Except near the pole, it is negative everywhere from June through August. It
is hence negative for a much longer time over the Arctic Ocean than suggested from
observations and may represent shortcomings in the satellite-derived fields.
5.8
Radiation Fluxes from Surface Observations:
Examples From Sheba
P. Persson et al. (
2002
) provide a complete description of the surface energy bud-
get at the SHEBA site in the Beaufort Sea. This is one of many articles outlining
SHEBA research results in the October 15, 2002 issue of the
Journal of Geophysical
Research
(Vol. 107, C10).
Figure 5.11
shows the mean annual cycles in net