Geoscience Reference
In-Depth Information
0.7
-0.1
0.1
180
-150
150
-120
120
-90
90
90
80
-60
60
70
60
-30
30
0
50
40
30
0
.3
180
-150
150
-0
.1
-120
120
-90
90
90
80
-60
60
70
60
-30
30
0
50
40
30
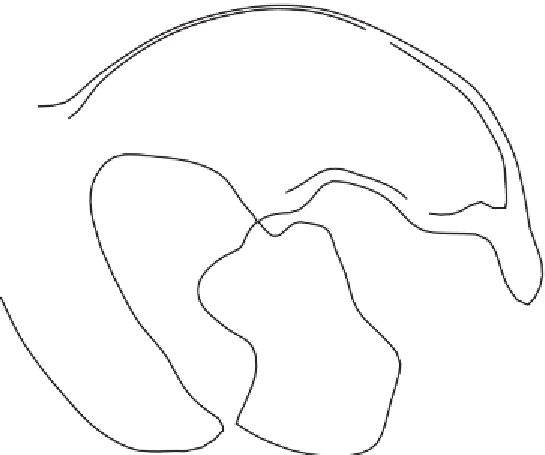
Figure 4.25.
Spatial patterns of the correlation between the PNA index and 500-hPa
heights for (a) winter, (b) summer, based on data from the NCEP/NCAR reanalysis for
the 1960-2010 period (courtesy of A.P. Barrett, NSIDC, Boulder, CO).