Geoscience Reference
In-Depth Information
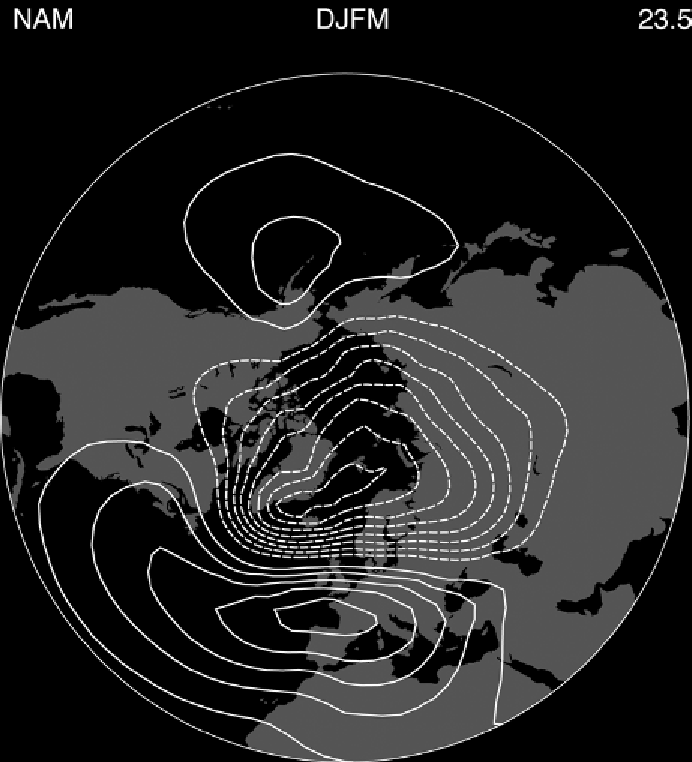
Figure 4.21.
Normalized leading EOF of winter (December-March) sea level pressure
anomalies over the Northern Hemisphere (20-90°N). The pattern (accounting for
23.5% of the variance in Northern Hemisphere sea level pressure) is displayed in term
of amplitude (hPa) obtained by regressing the hemispheric sea level pressure anomalies
on the leading principal component time series. The contour interval is 0.5 hPa and the
zero contour has been excluded. The data cover the 1899-2001 period (from Hurrell
et al.,
2003
, by permission of AGU).
symmetric (or annular), whereas that of the troposphere and the surface is charac-
terized by a wavier pattern. The primary pattern of variability has the same basic
features - in the stratosphere, it is primarily in the strength of the annular vortex,
whereas for the troposphere and surface, it is the wavy pattern. The NAO frame-
work focuses on the Atlantic sector, where the surface and tropospheric variabil-
ity is strongly expressed. However, in the AO framework, the winter stratospheric
variability and that for the troposphere and surface are not considered in terms of