Geoscience Reference
In-Depth Information
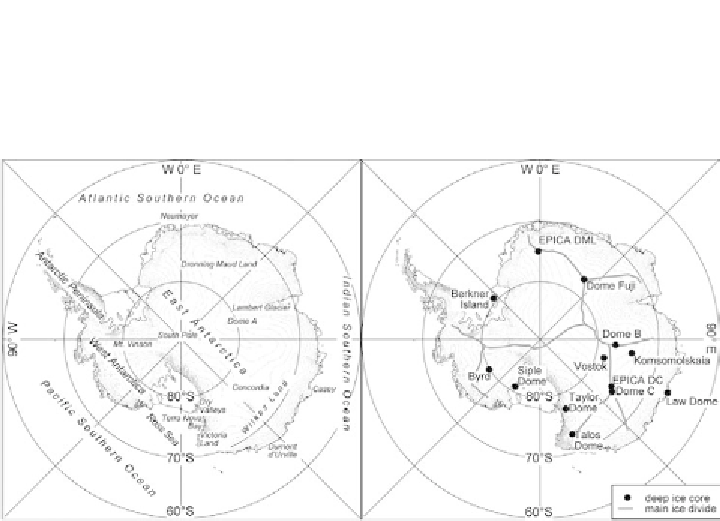
Figure 3.16
Map of Antarctica showing on the left, the main geographical sectors,
and the right, the main deep drilling locations together with the main ice divides and the
topography. (Credit: M. Frezzotti)
(a)
4000
3500
(b)
Temperature (
C)
3000
-60
-50
-40
-30
-20
-10
0
0
2500
-100
2000
1500
-200
1000
-300
500
-400
0
y = 6.34 x - 62.71
R
2
= 0.91
-500
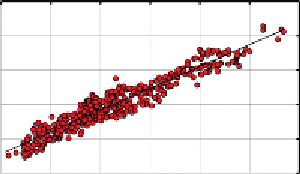
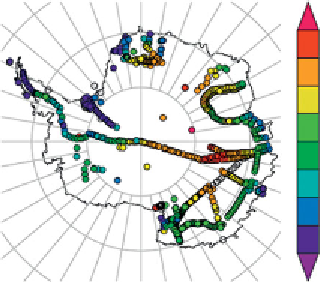
Figure 3.17 (a) Map of Antarctica showing the locations where snowfall, surface snow and
deep ice cores have provided information on the local annual mean precipitation isotopic
composition. Large areas have never been sampled. The colour scale re
ects the elevation of
the site (in metres above sea level). (b) Isotopic thermometer showing, from these locations, the
relationship between precipitation, isotopic composition and temperature. A
δ
D of 0 means
that the sample has the same isotopic composition as the Standard Mean Ocean Water
(SMOW). A
δ
D value of -500
%
means that there are twice as few HDO molecules in the
sample than in the SMOW, as observed in inland East Antarctica, near Dome A. The
precipitation most markedly depleted in heavy water molecules is found in Antarctica.


Search WWH ::

Custom Search