Geoscience Reference
In-Depth Information
a
b
5
5
4
4
3
3
2
2
1
1
0
0
0
200
400
Number of Samples
600
800
1000
0
200
400
Number of Samples
600
800
1000
c
d
5
5
4
4
3
3
2
2
1
1
0
0
0
200
400
Number of Samples
600
800
1000
0
200
400
Number of Samples
600
800
1000
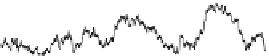
Fig. 3.1
Timeseries plots of parameter values in MCMC chains with (
a
) well tuned proposal, (
b
)
proposal variance that is too large, (
c
) proposal variance that is too small, and (
d
) proposal variance
that is too small and a chain that is started far from the mode of the target distribution. The
dashed
horizontal line
corresponds to the true parameter maximum likelihood value (
), and the
marginal distribution of each parameter is plotted in
gray
along the ordinate axis of each plot on
the
right hand side
. For reference, each marginal distribution is overlaid with a
black line
depicting
the distribution obtained by sampling with the well-tuned proposal (
a
)
D
0:5
the chain will mix very slowly. Conversely, if the width of the proposal distribution
is large, most proposed moves will be rejected (due to small Hastings ratio) and
the chain may not move at all. An example is shown in Fig.
3.1
, in which a single
parameter is estimated using three different proposal widths. The first (Fig.
3.1
a)
is tuned to an optimal 25 % acceptance rate (see below for a discussion on the
theory of optimal tuning), while the proposal width in the second and third are
set to an order of magnitude larger (Fig.
3.1
b) and an order of magnitude smaller
(Fig.
3.1
c), respectively. It can be seen that each explores the same portion of the
parameter space, and that their marginal PDFs (plotted on the right hand ordinate
axis) are all very similar. Even so, the case with large proposal variance gets stuck
for many successive iterations at the same parameter value, while the chain with
small proposal variance moves very slowly through the parameter space. A small
proposal width can also lead to problems if the chain is started at a point outside
of a region with sufficient probability density (Fig.
3.1
d); in this case, slow mixing
may cause the chain not to encounter a region with significant probability density
for many iterations and in the worst case may produce an erroneous sample of the
target distribution.
The trade-off between thorough and rapid sampling gives rises to the so-called
Goldilocks principle
; it is desirable to find a proposal scale that is not too large
and not too small, but just right. What is “just right”? In general, the ratio of


Search WWH ::

Custom Search