Geoscience Reference
In-Depth Information
a
d
b
e
c
f
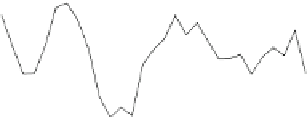
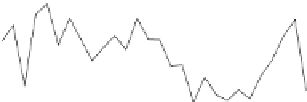
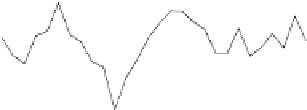
Fig. 25.17
Pattern correlation of model forecasts and observation of 2-m temperature, 10-m wind
speed and rainfall for 24-h (
a-c
) and 48-h (
d-f
) forecasts (Updated from
Xu et al.
(
2009
))
25.6.2.3
Pattern Correlation
In order to evaluate the spatial agreement between the model and the observations
quantitatively, pattern correlations (
Walsh and McGregor 1997
) were calculated
between the model simulated and observed fields. The pattern correlation
p
of two
i
spatial fields is simply the correlation of a series of points (
) from one field with
corresponding values from the other field:
P
.X
oi
X
o
/.X
fi
X
f
/
q
P
X
oi
X
o
2
q
P
X
fi
X
f
2
p
D
(25.7)
X
o
and
X
f
are the means of the observational field
.X
o
/
where
and model simulated
.X
f
/
field
fields respectively.
Figure
25.17
shows the pattern correlation of observational and model forecasted
values for 2-m temperature, 10-m wind speed and precipitation over the whole
prediction domain. The pattern correlation coefficient between observations and


Search WWH ::

Custom Search