Geoscience Reference
In-Depth Information
Ketsana 24-72h
Ketsana 24-72h
20
10
0
-10
-20
-30
-40
-50
200
180
160
140
120
100
80
60
40
20
0
CNOP:-13.5%
24h
30h
36h
42h
48h
54h
60h
66h
72h
SVs:-24.3%
CNOP
SVs
18
24
30
36
42
48
54
60
66
72
78
0
20
40
60
80
100 120 140 160 180 200
forecast time (h)
Mirinae 24-60h
error without dropsondes (km)
Mirinae 24-60h
350
300
250
200
150
100
50
0
-50
270
240
210
180
150
120
90
60
30
0
24h
30h
36h
42h
48h
54h
60h
35.7km
CNOP:-14.6%
SVs:-17.6%
11km
CNOP
SVs
18
24
30
36
42
48
54
60
66
0
30
60
90
120
150
180
210
240
270
forecast time (h)
error without dropsondes (km)
Nida 24-54h
Nida 24-54h
10
0
-10
-20
-30
-40
-50
-60
500
24h
30h
36h
42h
48h
54h
450
400
350
300
250
200
150
100
CNOP:-38.4%
SVs:-21.7%
50
CNOP
SVs
0
18
24
30
36
42
48
54
60
0
50
100 150 200 250 300 350 400 450 500
forecast time (h)
error without dropsondes (km)
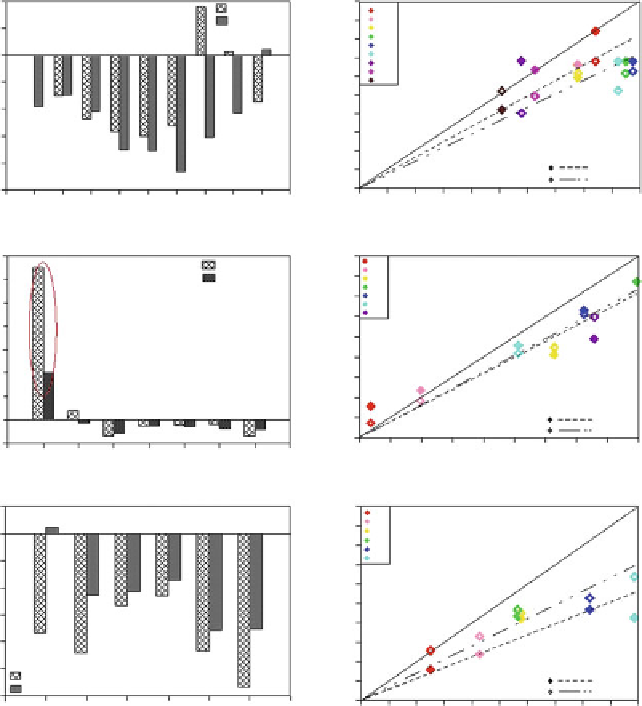
Fig. 24.17
Scatter diagrams of all track forecast errors for seven typhoon cases (
left
). The Y-axis
represents the track forecast errors with dropsondes, and the x-axis represents those without
dropsondes. Filled and empty diamonds denote the results of CNOPs and SVs, respectively. The
colour of each diamond indicates the forecast time. Histograms on the right are relative differences
corresponding to each case (From
Qin and Mu 2011a
)
Five kinds of experiments are designed and conducted: (1) no observations
are assimilated; (2) all observations are assimilated; (3) only the CNOP targeted
observations (observations in the CNOP sensitive area) are assimilated; (4) only the
FSV targeted observations (observations in the FSV sensitive area) are assimilated;
and (5) randomly targeted observations (observations within a randomly selected
area) are assimilated. The results of the OSEs showed that the DOTSTAR data have
a positive impact on the forecast of Nida's track (Table
24.6
); Assimilation of the
Search WWH ::

Custom Search