Geoscience Reference
In-Depth Information
a
b
c
2
2
2
CNOP
CNOP
CNOP
12h
24h
36h
0.8
0.6
0.4
0.2
-0.2
-0.4
-0.6
-0.8
0.8
0.6
0.4
0.2
-0.2
-0.4
-0.6
-0.8
0.8
0.6
0.4
0.2
-0.2
-0.4
-0.6
-0.8
39N
33N
39N
33N
39N
33N
27N
27N
27N
21N
15N
21N
15N
21N
15N
111E 120E 129E 138E
111E 120E 129E 138E
111E 120E 129E 138E
2
2
2
d
e
f
FSV
FSV
FSV
12h
24h
36h
39N
0.8
0.6
0.4
0.2
-0.2
-0.4
-0.6
-0.8
39N
0.8
0.6
0.4
0.2
-0.2
-0.4
-0.6
-0.8
39N
0.8
0.6
0.4
0.2
-0.2
-0.4
-0.6
-0.8
33N
33N
33N
27N
21N
27N
21N
27N
21N
15N
15N
15N
111E 120E 129E 138E
111E 120E 129E 138E
111E 120E 129E 138E
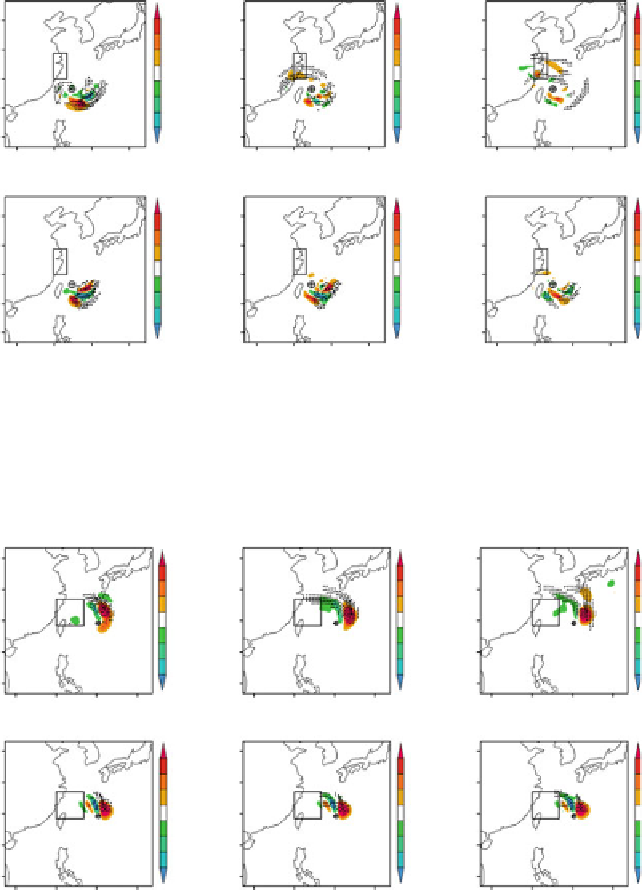
Fig. 24.5
TC Matsa (2005). The temperature (
shaded
, units: K) and wind (
vector
, units: m s
1
/
components of (
a
), (
b
), (
c
) CNOP and (
d
), (
e
), (
f
) FSV at
D
0:7
.The
boxes
indicate the
verification areas. The
indicates the position of the cyclone at 1200 UTC 04 Aug 2005. The
forecasts are generated for (
a
), (
d
)12h,(
b
), (
e
)24h,and(
c
), (
f
) 36 h later (From
Zhou and Mu
2012b
)
˚
a
b
c
2
2
2
CNOP
CNOP
CNOP
37N
37N
37N
12h
24h
36h
0.8
0.6
0.4
0.2
-0.2
-0.4
-0.6
-0.8
0.8
0.6
0.4
0.2
-0.2
-0.4
-0.6
-0.8
0.8
0.6
0.4
0.2
-0.2
-0.4
-0.6
-0.8
31N
31N
31N
25N
19N
25N
19N
25N
19N
13N
13N
13N
111E 120E 129E 138E
111E 120E 129E 138E
111E 120E 129E 138E
2
2
2
d
e
f
FSV
FSV
FSV
37N
37N
37N
12h
24h
36h
0.8
0.6
0.4
0.2
-0.2
-0.4
-0.6
-0.8
0.8
0.6
0.4
0.2
-0.2
-0.4
-0.6
-0.8
0.8
0.6
0.4
0.2
-0.2
-0.4
-0.6
-0.8
31N
31N
31N
25N
19N
25N
19N
25N
19N
13N
13N
13N
111E 120E 129E 138E
111E 120E 129E 138E
111E 120E 129E 138E
Fig. 24.6
TC Meari (2004). The temperature (
shaded
, units: K) and wind (
vector
, units: m s
1
/
components of (
a
), (
b
), (
c
) CNOP and (
d
), (
e
), (
f
) FSV at
D
0:7
.The
boxes
indicate the
verification areas. The
indicates the position of the cyclone at 1200 UTC 25 Sep 2004. The
forecasts are generated for (
a
), (
d
)12h,(
b
), (
e
)24h,and(
c
), (
f
) 36 h later (From
Zhou and Mu
2012b
)
˚
Search WWH ::

Custom Search