Geoscience Reference
In-Depth Information
a
b
c
Matsa
Matsa
Matsa
30km
60km
120km
39N
39N
39N
1.2
1
0.8
0.6
0.4
0.2
1.2
1
0.8
0.6
0.4
0.2
1.2
1
0.8
0.6
0.4
0.2
33N
33N
27N
33N
27N
27N
21N
21N
21N
15N
15N
15N
111E 120E 129E 138E
111E 120E 129E 138E
111E 120E 129E 138E
d
e
f
Meari
Meari
Meari
37N
37N
30km
60km
37N
120km
1.2
1
0.8
0.6
0.4
0.2
1.2
1
0.8
0.6
0.4
0.2
1.2
1
0.8
0.6
0.4
0.2
31N
31N
31N
25N
25N
25N
19N
19N
19N
13N
13N
13N
111E 120E 129E 138E
111E 120E 129E 138E
111E 120E 129E 138E
g
h
i
Mindulle
Mindulle
Mindulle
30km
60km
120km
28N
24N
20N
16N
12N
28N
24N
20N
16N
12N
28N
24N
20N
16N
12N
1.2
1
0.8
0.6
0.4
0.2
1.2
1
0.8
0.6
0.4
0.2
1.2
1
0.8
0.6
0.4
0.2
114E 121E 128E 135E
114E 121E 128E 135E
114E 121E 128E 135E
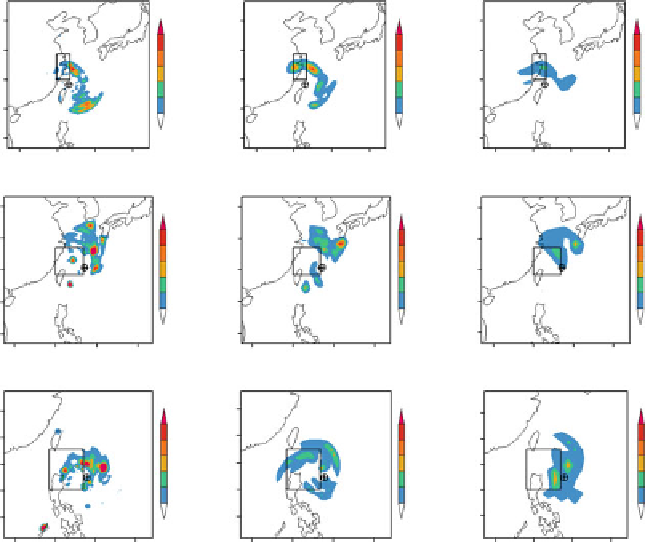
Fig. 24.1
The vertically-integrated energies of CNOP: (
a
-
c
)TCMatsa;(
d
-
f
) TC Meari; (
g
-
i
)TC
Mindulle. (
a
,
d
,
g
) at a resolution of 30 km, (
b
,
e
,
h
) at a resolution of 60 km, and (
c
,
f
,
i
)at
a resolution of 120 km. The
boxes
indicate the verification areas. The “
˚
” symbol indicates the
initial position of the cyclone (From Zhou and Mu 2012a)
For each case, the sensitive areas identified using different resolutions are
different from each other (Fig.
24.1
); however, common sensitive areas occur at
the three resolutions, and the sizes of the common areas are different from case
to case. In general, the sizes of common areas are bigger between sensitive areas
at the lower resolution. This can be deduced from the similarities of the energy
distributions between each resolution for the three cases (Table
24.1
). Tor the three
cases, the similarities between the lower resolutions (60 and 120 km) are greater
than those between the finer resolutions (30 and 60 km); moreover, this illustrates
that more small-scale activity would be resolved at higher resolutions.
From the analysis of the similarities, it can be induced that the sensitive areas
identified at lower resolutions are also helpful for improving the forecast at finer
resolution. However, to get the largest improvement at a high resolution, it is better
to use the sensitive areas identified at the same resolution. A resolution at which the
nonlinearity could be explored has been suggested to be used in the identification
of the sensitive areas. Generally speaking, because usually the forecasts at higher
resolutions are better than those at lower resolutions, and the high resolutions are
Search WWH ::

Custom Search