Geoscience Reference
In-Depth Information
Value of maximum variance reduction (hPa
2
/
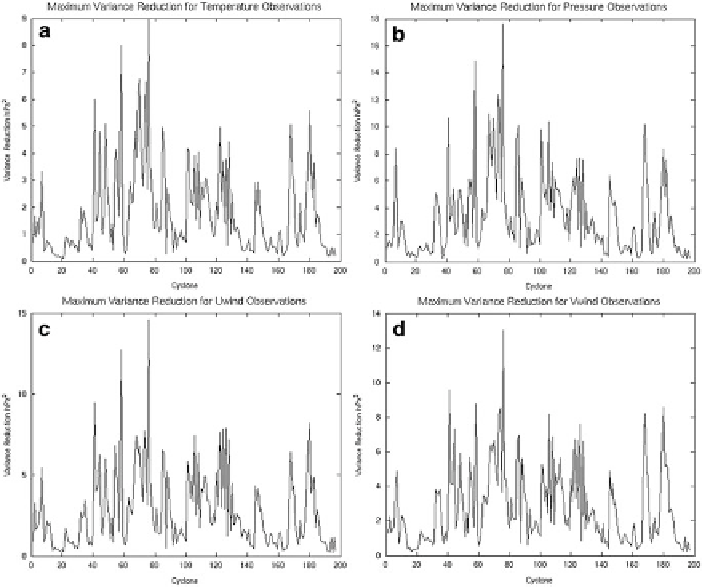
Fig. 23.5
of the response function for all cyclones
for observations of (
a
) temperature, (
b
) pressure, (
c
) zonal wind, and (
d
) meridional wind
and wind, the level of maximum values exists throughout the troposphere, whereas
for pressure the maximum levels are confined to the lower half of the troposphere
below 500 hPa. Furthermore, the level of maximum variance reduction is near the
surface for pressure observations for a large number of cyclones. This suggests a
substantial benefit might be gained by assimilating scatterometer sea-level pressure
retrievals, such as those that used to be provided by the QuickSCAT satellite, with
regard to forecasts of North American land-falling mid-latitude cyclones.
Figure
23.5
depicts the maximum values of variance reduction for each cyclone,
regardless of vertical level, for each observation type. As shown in Fig.
23.3
,the
largest values are associated with pressure observations. For all observations,
significant variability exists with these maximum values as they range from near
zero to about
hPa
2
for winds, to about
hPa
2
for temperature, and to roughly
15
9
hPa
2
for pressure. Interestingly, the maximum values for all observation types
follow the same general trend. When a cyclone exhibits large maximum variance
reduction for one type of observation (e.g. pressure), it also exhibits large maximum
variance reduction for the other types of observations (wind and temperature). This
property reveals that the largest impacts of targeted observations for the cyclones in
this study are independent of observation type.
18
Search WWH ::

Custom Search