Geoscience Reference
In-Depth Information
a
b
(mm)
(mm)
(m /s)
(m/s)
c
(mm)
(m/s)
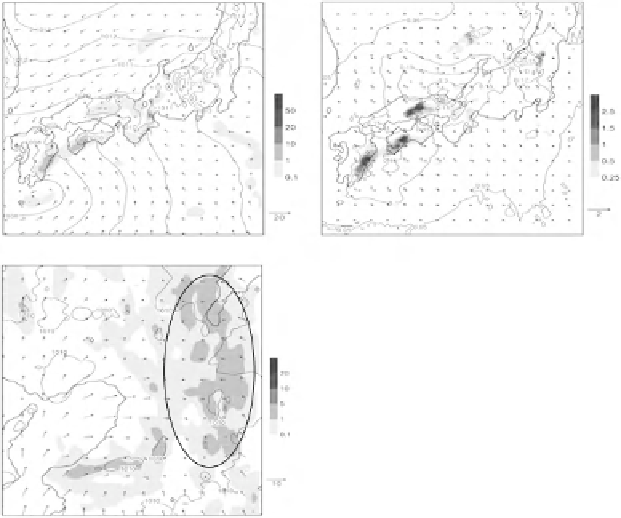
Fig. 20.5
(
a
) Ensemble mean and (
b
) spread of 1 h rainfall (
shaded regions
), horizontal wind
at the height of 20 m (
vectors
) and sea level pressure (
contours
) at 15 JST 5th September 2008
reproduced by the Outer LETKF. (
c
)Sameas(
a
) except ensemble mean by the Inner LETKF.
Circles
in (
c
) indicate the rainfall regions generated in mountainous areas. An
arrow indicates
the
rainfall region that developed into the thunderstorm of Sakai City
well reproduced in one third of the ensemble members, though there was a time lag
of 1 h. When these rainfall regions were traced backward in time, these reproduced
intense rainfall regions were originated from the small rainfall regions near Sakai
City at 15 JST (indicated by arrows in Fig.
20.6
a). As explained in the comparison
with the ensemble mean distribution, these small rainfall regions were much weaker
than the observed one. To increase the accuracy of initial conditions, in other words,
to increase the number of the ensemble members in which the local heavy rainfall
was reproduced, more high-resolution data, such as GPS water vapor data or Radar
wind data, would be helpful. The impacts of this high-resolution data are explained
in Sect.
20.5
.
20.4.2
Feedback to Outer LETKF and Convection Cells Near
the Boundary of Inner LETKF
In this nested system, the analyzed values of the Outer LETKF within the regions
of the Inner LETKF were replaced with those of the Inner LETKF every 6 h. It is


Search WWH ::

Custom Search