Geoscience Reference
In-Depth Information
a
b
c
W
L
C
Fig. 20.3
Surface meteorological data observed by AMeDAS and the Meteorological Observato-
ries of JMA at 1400 JST 5th September 2008. (
a
) Horizontal wind, (
b
) Sea level temperature ( ˚ C),
(
c
) Sea level pressure (hPa)
a
09 J S T 5
t h
15 J S T 5
t h
17J S T 5
t h
Assimilation data
for Outer LETKF
conventional data
03 J S T 5
t h
09 J S T 1
st
6 hour analysis window
6 hour analysis window
observation data (every hour)
conventional data
6 hour analysis window
observation data (every hour)
conventional data
observation data (every hour)
conventional data
LETKF
analysis
LETKF
analysis
LETKF
analysis
B
B
B
N
o
c
s
t
s
m
o
o
t
h
e
r
N
o
c
s
t
s
m
o
o
t
h
e
r
Outer LETKF
Ensemble size:12
Grid interval: 15 km
Reflection in
Outer LETKF
Reflection in
Outer LETKF
Forecast
Boundary condition
Boundary condition
Downscale
Downscale
Downscale
L
L
L
Inner LETKF
Ensemble size:12
Grid interval: 1.875 km
A
A
A
S
S
1 hour analysis window
observation data
(every 10 minutes)
conventional data and
high resolution data
(e.g. GPS and Radar)
1 hour analysis window
observation data
(every 10 minutes)
conventional data and
high resolution data
(e.g. GPS and Radar)
b
c
Outer LETKF
4 Inner LETKFs
1 Inner LETKF
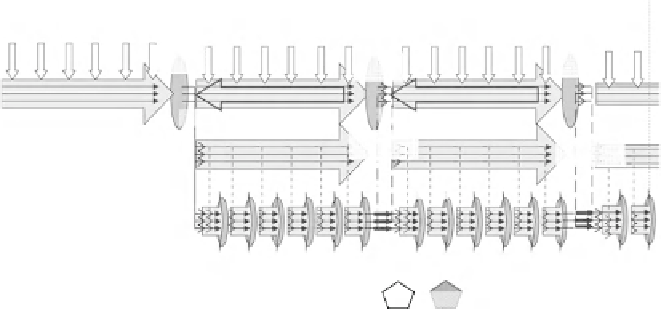
Fig. 20.4
(
a
) Schematic illustration of the nested LETKF system. (
b
,
c
) Schematic illustration of
the blending weights of the analyzed values of the Outer and Inner LETKFs. One Inner LETKF is
deployed in (
b
), and 4 Inner LETKFs are deployed side by side in (
c
).
Darker circles
indicate the
points where the weights of the Inner LETKF are larger


Search WWH ::

Custom Search