Geoscience Reference
In-Depth Information
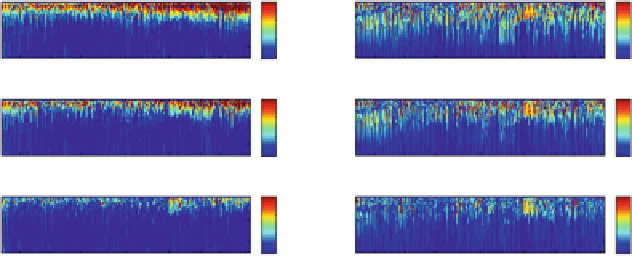
Non-Assimilated Glider minus FR Temperature
Non-Assimilated Glider minus FR Salinity
0
100
200
3
2
1
0
0
100
200
0.4
0.2
0
02 05
08
11
14
17
20 23
26
02 05
08
11
14
17
20 23
26
Non-Assimilated Glider minus FG Temperature
Non-Assimilated Glider minus FG Salinity
0
100
200
3
2
1
0
0
100
200
0.4
0.2
0
02 05
08
11
14
17
20
23
26
02 05
08
11
14
17
20 23
26
Non-Assimilated Glider minus 4DVR Temperature
Non-Assimilated Glider minus 4DVR Salinity
0
100
200
3
2
1
0
0
100
200
0.4
0.2
0
02 05
08
11
14
17
20
23
26
02 05
08
11
14
17
20 23
26
Days of August, 2003
Days of August, 2003
Fig. 15.8
Same as Fig.
15.7
, except for non-assimilated glider observations
This result was expected because in most cases the withheld observations were
located in the vicinity of assimilated observations. There are still some large
temperature and salinity discrepancies in the analysis, usually around the beginning
of the assimilation cycle.
15.4.6
Qualitative Fitting of the Data
The assimilation system's ability to fit the observations is further examined by
comparing the differences between the observations and the free running model, the
first guess and the analysis for all the observations and at all times, for both MODAS
and AOSN II data. The free running model is integrated from the initial conditions
and is never re-initialized, while the first guess for an assimilation cycle is initialized
by the analysis at the end of the previous cycle. Elements of these difference vectors
are binned by comparing their magnitude to the observations standard deviation.
For example, all elements that are smaller than a standard deviation in absolute
value are binned together, and so are all elements whose absolute value is between
one and two standard deviations, and so on. The number of elements in each bin is
then converted into a percentage of the number of assimilated observations. The
results plotted as a cumulative bar chart on Fig.
15.9
show that the assimilated
solution with MODAS data fits 80 % and 90 % of the observations to within one
and two standard deviations respectively, while the corresponding numbers for the
first guess are 60 % and 75 %, and 45 % and 63 % for the free running model. Some
posterior misfits, although only a small percentage, are larger than 7 observations
standard deviations, which obviously violate the Gaussian assumption on the errors
in general. Similarly, for the AOSN II data, assimilated solution fits 86 % and 95
% of the observations to within one and two standard deviations respectively, while
Search WWH ::

Custom Search