Geoscience Reference
In-Depth Information
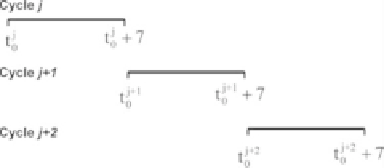
Fig. 14.7
A schematic to illustrate the 7 day data assimilation cycles used in the near real-time
system. The starting and ending times of cycle
j
are denoted t
j
0
and t
j
0
C
7
respectively, and the
starting time of cycle
j
C
1
corresponds to the ending of time of cycle
j
.The
prior
circulation
initial condition for cycle
j
C
1
is taken as the
posterior
circulation estimate at the end of cycle
j
Table 14.2
A summary of the observations and platforms currently used in the UCSC near real-
time analysis system for the CCS. CalCOFI Line 67 is a repeat glider line that runs offshore from
the California coast just south of Monterey Bay out to 316 km offshore. This CalCOFI line is
maintained by the Monterey Bay Aquarium Research Institute (MBARI).
OSTIA
: operational sea
surface temperature and sea ice analysis, and is described by
Stark et al.
(
2007
),
CaLCOFI
:the
California cooperative fisheries investigation
Observation type
Observation platform
Source
Combined error
SSH
Altimeter
Aviso
0.02 m
0:4
ı
C
SST
Various
OSTIA
UK Met Office
Hydrographic data
Glider, CalCOFI Line 67
MBARI
0:1
ı
CforT
0.01 for S
algorithm is used in this case, for historical reasons, in conjunction with a 7 day data
assimilation window in which the
prior
initial condition for each analysis cycle is
the
posterior
circulation estimate at the end of the previous cycle. In this system,
the 4D-Var control vector is composed of the initial conditions only. The procedure
used is illustrated schematically in Fig.
14.7
.
Because of the near real-time aspect of this system, the number and type of ocean
observations that are available for assimilation is limited. Information about the
observations that are currently used is given in Table
14.2
.
An example analysis is shown in Fig.
14.8
which shows the
prior
and increments
for SST, sea surface salinity (SSS), sea surface height (SSH), for the analysis cycle
starting on 2 Feb., 2012. The
prior
fields for SST, SSS and SSH all reveal the
complex nature of the meso-scale circulation environment associated with the CCS.
The increments reveal that most of the corrections that are being made to the
prior
during this cycle are generally at the mesoscale also, although some larger scale
corrections are present as well, as for example in SSH (Fig.
14.8
e) in the northern
part of the domain.
The near real-time analyses, like that of Fig.
14.8
, are produced in support of
the Central and Northern California Ocean Observing System (CeNCOOS) and are
freely available at
http://oceanmodeling.pmc.ucsc.edu/ccsnrt
.
Typical users include
fisherman, marine planners, and search and rescue organizations.


Search WWH ::

Custom Search