Geoscience Reference
In-Depth Information
f
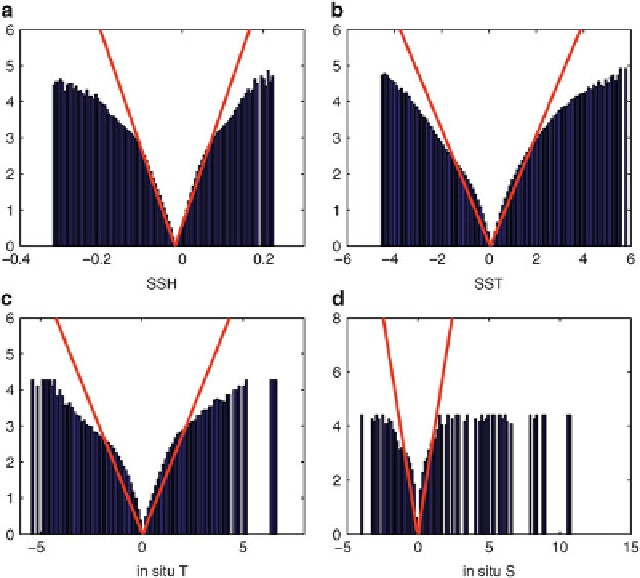
Fig. 14.5
corresponding to the same data groupings
showninFig.
14.4
.The
red curves
in each case represent the lines
The transformed frequency distributions
abs
x
=
f
where
y
D
f
is
.
o
C
b
/
1=2
corresponding to the best fit Gaussian distributions shown in Fig.
14.4
the estimate of
for the in situ observations, there are typically a significant number of outliers,
particularly in the case of salinity. Following
Andersson and Jarvinen
(
1999
), the
threshold parameter
was chosen to reflect a significant departure of the straight
lines in Fig.
14.5
from the distribution. Based on Fig.
14.5
, we apply (
14.9
) only to
the in situ observations with
˛
, which corresponds to rejecting observations
that are greater than
4.
b
C
o
/
1=2
from the mean of the distribution, which
corresponds to
2:8
ı
Cand
1:2
˛
D
16
for in situ temperature and salinity respectively.
When applying (
14.9
), the prescribed
o
evaluated at the observation
locations are used during each 4D-Var cycle. For this choice of
b
and
it was found that
on average less than 1 % of the in situ observations are rejected during 4D-Var.
˛
14.4.6
Preliminary Results
At the time of writing, WCRA31 is underway with
5
years completed so far and
will require approximately another 3 months to complete. In this section we are
Search WWH ::

Custom Search