Geoscience Reference
In-Depth Information
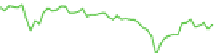
Fig. 13.12
Same as Fig.
13.10
, except for layer pressure observations. Layer pressure is computed
from density using temperature and salinity profiles (see text for details)
points. The total time of the 3DVAR step in the NCODA analysis system is the
maximum time needed to complete any of the subdomains—in this case 14.2 min to
complete the Indian Ocean analysis. Efficiency of the 3DVAR is clear, especially
in the large Pacific basin where
>1
million observations were assimilation into
195.2 million grid points in
9:8
min wall clock time. Table
13.2
also shows how
well the analysis scales using different numbers of processors. Reduction of the
Indian Ocean run time, and thus speed-up of the 3DVAR analysis step in global
HYCOM analysis/forecast system, can easily be achieved by simply increasing
the number of processors. In general, the post-multiplication step of the analysis
is more computationally expensive than the observation space solver. Accordingly,
the analysis contains an option to perform the post-multiplication step on a reduced
resolution grid. The innovations are always formed from the full resolution model
grid, and the solution vector is calculated using all of the observations, but now the
solution is mapped to every other (or any multiple) horizontal grid point. This option
results in a considerable saving in computational time with no loss of information
when analysis correlation length scales generally exceed the model grid resolution.


Search WWH ::

Custom Search