Geoscience Reference
In-Depth Information
Satellite & In Situ SST
Thinned SST
Length
Scales
10 km
200 km
10 km
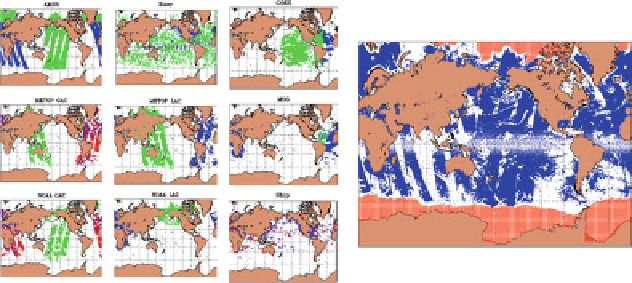
Fig. 13.8
Data thinning of global SST data. Satellite and in situ sources SST show in
left panel
(blue daytime, green nighttime, red relaxed day satellite retrieval types). The SST data sources are
(in order from top to bottom): AMSR-E, Drifting and Fixed Buoy, GOES E/W, METOP-A GAC,
METOP LAC, MeteoSat-2, NOAA 18,19 GAC, NOAA 18,19 LAC, Surface Ship (engine room
intake, bucket, hull contact sensor). Thinned data for assimilation is show in
middle panel
(
blue
—
SST observation;
red
—freezing sea water under ice covered seas). Schematic of how correlation
lengths vary as a function of latitude shown on
right
observed profile is merged to the forecast profile by selecting the depth at which
the merge is complete based on the shape of the extracted forecast model profile.
This target depth is set to be the second zero crossing of the forecast profile
curvature. Note that the merge can fail if a suitable target depth is not found or
if the difference between the observed and model profile at the merge depth is too
large (
>3
ı
C for temperature;
PSU for salinity). Second, similar to the high
density surface-only data, profile observations are thinned in the vertical to remove
redundant data. The profile thinning is done by averaging temperature and salinity
observations at observed levels within vertical layers defined by the mid-points
of the model vertical grid. Since the ocean circulation models interfaced with the
3DVAR have very different vertical coordinates (NCOM uses a sigma/z vertical
grid; HYCOM uses a z/isopycnal/sigma hybrid vertical grid), model vertical levels
at the grid point closest to the profile location are used to define layer thicknesses.
Third, in cases where profile vertical sampling is inadequate to resolve the local
vertical correlation length scales, the profile is expanded in the vertical by linearly
interpolating data to interleaving levels in order to form a more vertically dense
profile. This scheme ensures vertically smooth analysis increments at all model
levels even when vertical correlations are short due to strong density stratification.
This situation routinely occurs in the tropics with the sparse vertical sampling
in profiles received from the Tropical Atmosphere Ocean (TAO), Triangle Trans-
Ocean Buoy Network (TRITON), and Prediction and Research Moored Array in
the Atlantic (PIRATA) buoys. It is clear that the vertical sampling of the tropical
mooring arrays needs to be improved.
>0:1
Search WWH ::

Custom Search