Geoscience Reference
In-Depth Information
Velocity Prediction Error (cm/s) 0 M Depth
Velocity Prediction Error (cm/s) 0 M Depth
0
5
10
15
20
25
30
0
5
10
15
20
25
30
Velocity Prediction Error (cm/s) 0 M Depth
0
5
10
15
20
25
30
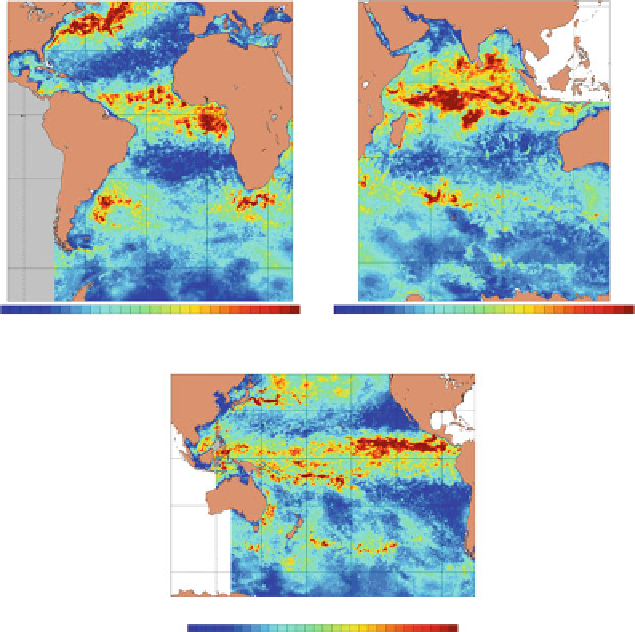
Fig. 13.7
Surface velocity (cm/s) background error standard deviations valid 20 January 2012 in
global HYCOM analysis domains: Atlantic, Indian, and Pacific
density does not necessarily improve the analysis. More data will require more
conjugate gradient iterations while, more importantly, it may not noticeably alter the
results given the smoothing operation of the post-multiplication step (see discussion
in Sect.
13.2
). Figure
13.8
shows an example of data thinning results for 6 h of
satellite SST observations in the FNMOC GHRSST analysis. Even with just 6 h
of SST data the various satellite missions and in situ sources show a high degree
of spatial overlap. The data thinning removes this data redundancy and creates a
sampling pattern consistent with the horizontal correlation length scales defined for
the analysis. In this case, length scales are based on Rossby radius of deformation,
which varies significantly across the grid. As a result, there is increased data
thinning near the equator where length scales are
200
km. Elsewhere, especially
at high latitude, the data thinning is much less, and satellite retrievals with footprint
resolutions of 2 km and 8 km are directly assimilated without any spatial averaging.
Search WWH ::

Custom Search