Geoscience Reference
In-Depth Information
Salinity Prediction Error (PSU) 0 M Depth
Salinity Prediction Error (PSU) 0 M Depth
<0
.05
.1
.15
.2
.25
.3>
<0
.05
.1
.15
.2
.25
.3>
Salinity Prediction Error (PSU) 0 M Depth
<0
.05
.1
.15
.2
.25
.3>
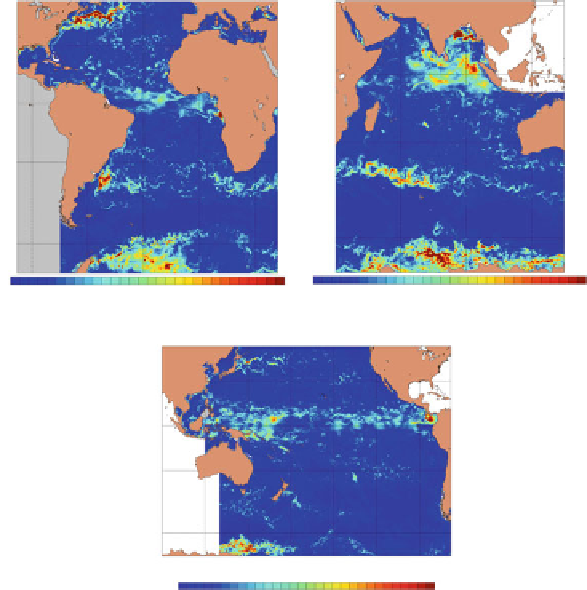
Fig. 13.6
Surface salinity (PSU) background error standard deviations valid 20 January 2012 in
global HYCOM analysis domains: Atlantic, Indian, and Pacific
altimeter SSH observations in a single day. These high-density, surface-only, data
types must be thinned prior to the analysis to remove redundancies in the data
and minimize horizontal correlations among the observations. The data thinning
is achieved by averaging innovations into bins with spatially varying sizes defined
using the ratio of horizontal correlation length scales and horizontal grid resolution.
Innovations are inversely weighted based on observation error in the data thinning
process, and in the case of SST observations the water mass of origin is maintained
(see
Cummings 2005
for a discussion of the Bayesian water mass classification
scheme). The length scale to grid mesh ratio bin sizes automatically adjust to
changes in the spatially varying horizontal correlation length scales, but are never
smaller than the underlying model grid mesh. As a result, fewer data are thinned
as the grid resolution decreases or as the correlation length scales shorten. This
adaptive feature of the data thinning process can be used to decrease (increase)
the amount of data thinning by artificially shortening (lengthening) the horizontal
correlation length scales given a fixed model grid. Note that simply increasing data
Search WWH ::

Custom Search