Geoscience Reference
In-Depth Information
b
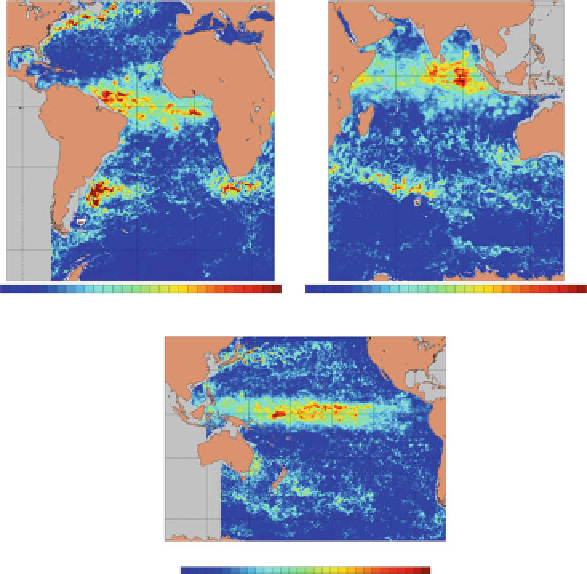
Temperature Prediction Error (C)
150 M Depth
Temperature Prediction Error (C)
150 M Depth
<0
.2
.4
.6
.8
1
1.2>
<0
.2
.4
.6
.8
1
1.2>
Temperature Prediction Error (C)
150 M Depth
<0
.2
.4
.6
.8
1
1.2>
Fig. 13.5
(continued)
factors. Representation errors, however, are a function of the resolution of the model
and the resolution of the observing network. For satellite retrievals with known
measurement footprints, representation errors are set equal to the gradient of the
background field at the observation location when the retrieval footprint exceeds the
model grid resolution. Representation error of profile observations consists of two
additive components. The first component is set proportional to the observed profile
vertical gradients of temperature and salinity as a proxy for uncertainty associated
with internal waves. The second component is estimated from the variability of
multiple observed profile level data averaged into layers defined by the model
vertical grid (see Sect.
13.4.2
).
13.4
Ocean Observations
The analysis makes full use of all sources of the operational ocean observations.
Ocean observing systems assimilated by the 3DVAR are listed in Table
13.1
, along
Search WWH ::

Custom Search