Geoscience Reference
In-Depth Information
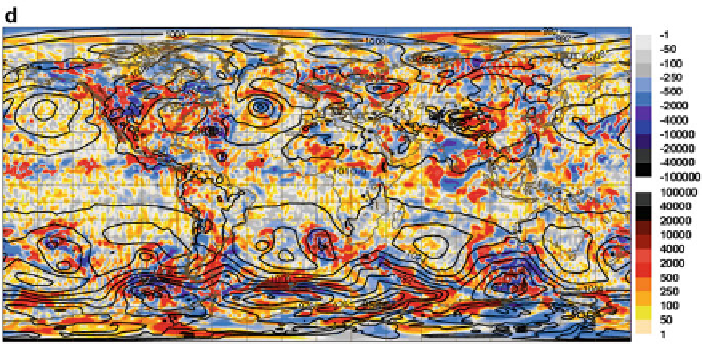
Fig. 11.6
Adjoint sensitivity of the 24-h forecast error to initial conditions in (
a
,
c
) specific
humidity (J kg
1
/(g kg
1
)) and (
b
,
d
) temperature (J kg
1
/K) at the lowest model level for the
situation on 28 August 2010 at 21:00 UTC. The results are presented for (
a
,
b
) an experiment with
dry parametrization schemes (i.e. vertical diffusion, gravity wave drag, non-orographic gravity
wave and radiation) used in the adjoint model and (
c
,
d
) with moist processes also included.
Sensitivities are shown with colour shading.
Black isolines
represent mean-sea-level pressure (hPa)
points out the regions where temperature ought to be modified in order to change
precipitation inside the target box, 24 h later. In Fig.
11.8
, the region of maximum
sensitivity is found in the vicinity of the cold front associated with the 990 hPa
low pressure system located at 19
ı
W/47
ı
N. The dipolar pattern of sensitivities
indicates that a strengthening of the cross-frontal temperature gradient would result
in a precipitation increase inside the black box, 24 h later.
Of course, it would also be possible to plot sensitivities with respect to moisture,
wind and surface pressure fields for this case (not shown). In fact, sensitivities can
be computed with respect to any variable which is part of the control vector of
the adjoint model. However, one should also keep in mind that the relevance and
usefulness of adjoint sensitivities can be limited by the degradation of the linearity
assumption over time.
11.6.3
Data Assimilation
Experiments have been performed over July-September 2011 in order to compare
two versions of the ECMWF 4D-Var system at resolution T511
3
L91: the first one
including the linearized physics described above and the second one without it.
Actually, in the version without the described linearized physics, a simple linear
3
T511 corresponding approximately to 40 km
Search WWH ::

Custom Search