Geoscience Reference
In-Depth Information
0.05
0
−0.05
−0.1
−0.15
−0.2
1
5
10
15
20
25
assimilation/forecast cycle
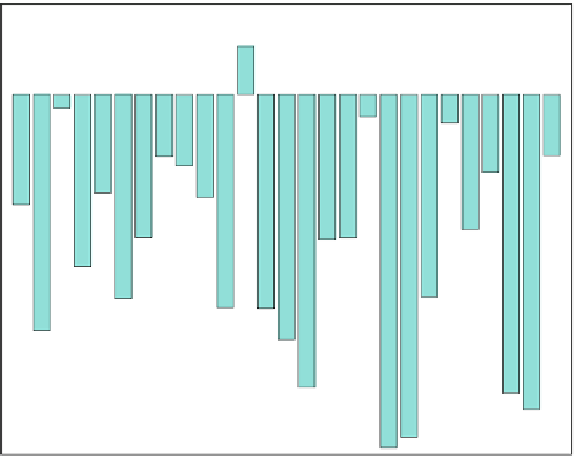
Fig. 9.7
The sensitivity of the 24-h forecast error to the background error covariance weight
coefficient
s
b
during each assimilation/forecast cycle
in a 6-h 4D-Var assimilation interval during the time period of 2010 September 29-
October 26 (data for 2010 October 15 was not incorporated in this study). For each
observed parameter, the total number of observations assimilated in NAVDAS-AR
to produce the 00 UTC analyses over the period of study (27 data sets) is shown in
Fig.
9.6
together with the OBSI (
9.10
)and(
9.11
). It is noticed that each observed
parameter had a benefic OBSI on the forecast error reduction and that radiance and
wind speed observations had the largest overall impact. The total precipitable water
results are for profiles through an entire atmospheric column, which may explain
their relatively high value of impact per observation.
First guidance derived from the error covariance sensitivity analysis is on the
proper weighting in the DAS between the information provided by the background
estimate and the observing system as a whole (covariance parameterization through
a single parameter). This is obtained by systematically monitoring the forecast
error sensitivity to the background error covariance weight coefficient
s
b
(
9.47
).
s
b
-sensitivity values for each assimilation/forecast cycle are shown in
Fig.
9.7
. The sensitivity magnitude is closely determined by the forecast episode
and negative derivative values indicate that, in general, inflation of the background
error covariance is of potential benefit to the forecasts (at weight
The forecast
s
b
D
1
the
s
b
parameter). An alternative
forecast aspect is a locally decreasing function of the
s
b
-sensitivity guidance is that, in general, the information
provided by the observing system as a whole is underweighted in the DAS.
interpretation of the


Search WWH ::

Custom Search