Geoscience Reference
In-Depth Information
a
b
37.2
10
0
36.8
1
36.4
0.8
0.6
10
−1
36.0
0.4
0.2
35.6
10
0
10
1
10
2
10
3
−123.2
−122.8
−122.4
−122.0
−121.6
iterations
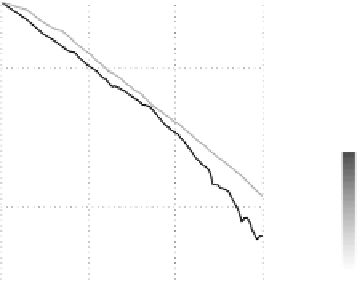
Fig. 8.5
with iterations for the
HM (
black
)andMC(
gray
) methods for the
B
2
model. The
lower curves
are obtained after optimal
smoothing of the estimates. The
thin horizontal lines
show the error levels that are provided by
the asymptotic zeroth- (
(
a
) reduction of the domain-averaged diagonal estimation error
h
"
i
h
"
iD
0.17) and first-order (
h
"
iD
0.10) methods which do not require
iterative schemes. (
b
) Horizontal distribution of
.
B
2
/
after 60 iterations of the HM method with
smoothing
are higher near the boundaries because part of the domain available for dispersion
is screened by the condition that prescribes zero flux across either open or rigid
boundaries.
8.3.3.2
Statistical Methods
The MC method is implemented in two ways: In the first series of experiments, the
components of
s
k
are taken to be either 1 or 1 with equal probability. In the second
series they are drawn from the white noise on the interval [1, 1]. The residual error
"
is computed using (
8.41
). In both se
ri
es, the rates of reduction of
"
with iteration
are similar and closely follow the
p
k
law (upper gray line in Fig.
8.5
a).
To improve the accuracy, the MC estimates are low-pass filtered with the
corresponding
B
-operators at every iteration (Fig.
8.5
b). To optimize the filter,
the diffusion operators in
B
g;2
are multiplied by the tunable parameter
k
,which
1=2
times. The
lower lines in Fig.
8.5
a demonstrate the result of such optimal smoothing: this
procedure resulted in an almost four-fold reduction of the domain-averaged error
h
"
i to 0.16 after performing 60 iterations (averaging over 60 ensemble members).
Experiments with the HM method (black curves in Fig
8.5
a) show that horizontal
smoothing significantly improves the accuracy of the estimates, especially after the
first few dozens of iterations. Comparison with the MC method (gray curves in
Fig.
8.5
a) demonstrates a noticeable advantage of the HM technique (black curves),
which remains visible at higher iterations
effectively reduced the mean decorrelation (smoothing) scale
even after smoothing (lower
curves). This advantage increases with increasing iterations for two reasons: The
k > 100


Search WWH ::

Custom Search