Geoscience Reference
In-Depth Information
52
°
W
°
W
56
°
W
°
W
°
W
°
W
56
°
W
54
°
W
20
°
N
20
°
N
18
°
N
18
°
N
o
o
p
16
°
N
16
°
N
14
°
N
14
°
N
Prior Mean
Kalman Analysis
56
°
W
°
W
52
°
W
°
W
56
°
W54
°
W52
°
W50
°
W
20
°
N
20
°
N
18
°
N
18
°
N
o
o
p
p
16
°
N
16
°
N
14
°
N
14
°
N
Quadratic Analysis
Particle Analysis
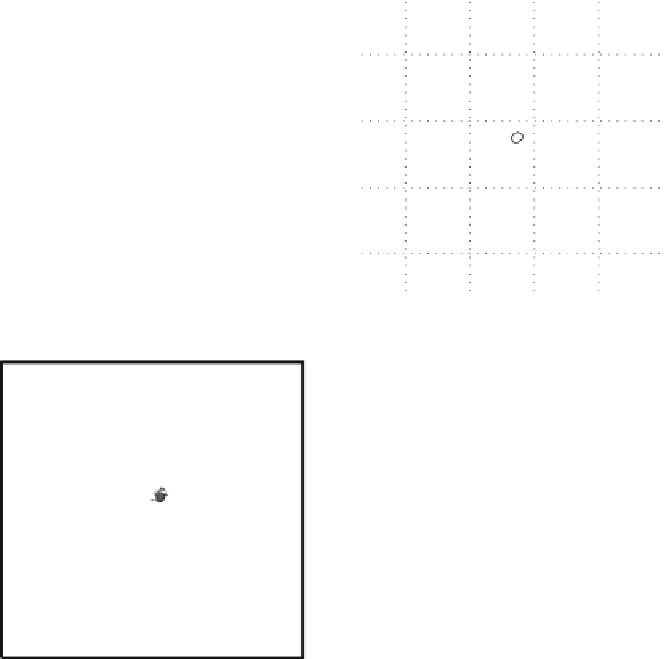
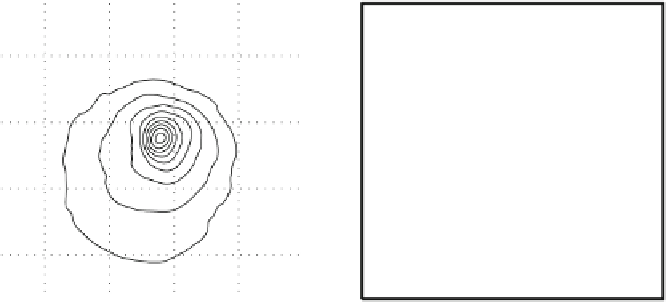
Fig. 7.6
Estimates of the posterior mean for Hurricane Katia (2011). The sea-level pressure is
plotted in each panel with a contour from 990 to 1,016 mb at intervals of 2 mb. The “
o
” denotes the
location of the observation and the “
p
” denotes the location of the center of the sea-level pressure
in the prior mean
nonlinear regression against that resulting from the application of Bayes' rule as
seen through particle filtering. In Fig.
7.6
a is shown the prior mean sea level pressure
that will be used in the DA experiments. In Fig.
7.6
d is the true posterior mean from
the particle filter after assimilation of just the position observations, which consists
of two observations; one of which is the location in longitude and the other is the
location in latitude. One can see that the result of the position observations was to
shift the mean to the Northeast. Note however that the posterior mean was not shifted
all the way to the observation location. The observation location is at about one
standard deviation from the prior mean in latitude and two standard deviations from
the prior mean in longitude. Because this location observation is at a location that is
greater than one standard deviation in longitude and the observation error variance is


Search WWH ::

Custom Search