Geoscience Reference
In-Depth Information
b
60N
Radiosondes
1.4
1
0.7
0.5
0.3
0.2
−
0.2
−
a
50N
40N
0.3
−
0.5
−
0.7
−
30N
1
−
1.4
−
1.8
−
2.2
−
20N
2.6
−
3
10N
130w
120w 110w 100w
90w
80w
70w
60w
d
60N
Radiosondes
1.4
1
0.7
0.5
0.3
0.2
−
0.2
−
c
50N
40N
0.3
−
0.5
−
0.7
−
1
30N
−
1.4
−
1.8
−
20N
2.2
−
2.6
−
3
10N
170w 160w 150w 140w 130w 120w 110w 100w
f
60N
Radiosondes
e
1.4
1
0.7
0.5
0.3
0.2
−
0.2
−
50N
40N
0.3
−
0.5
−
0.7
−
1
30N
1.4
−
−
1.8
−
2.2
−
20N
2.6
−
3
10N
20E
30E
40E
50E
60E
70E
80E
90E
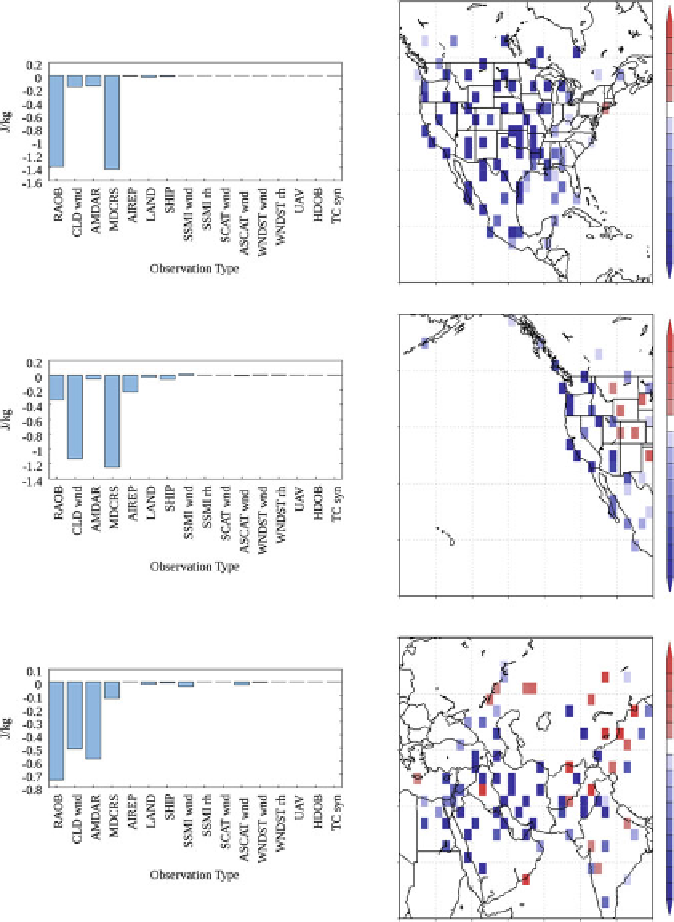
Fig. 6.4
Averaged observation impacts by type for each forecast cycle (
left
) and contribution at
radiosonde locations (
right
, multiplied by 1,000) for domains covering (
a
)and(
b
) the continental
United States, (
c
)and(
d
) the eastern Pacific Ocean and western United States, and (
e
)and(
f
)
southwest Asia. The impacts were calculated for 12 h forecasts valid over the period 0000 UTC
24-0000 UTC 31 Dec 2010. Values are in units of J kg
1
Search WWH ::

Custom Search