Geoscience Reference
In-Depth Information
4.47
4.25
60
°
N
4.04
3.83
3.61
3.40
30
°
N
3.18
2.97
2.75
0
°
N
2.54
2.33
2.11
1.90
30
°
S
1.68
1.47
1.25
1.04
60
°
S
0.82
0.61
0.14
150
°
W
120
°
W
°
W
°
W
°
W0
°
E30
°
E
°
E
°
E
°
E
°
E
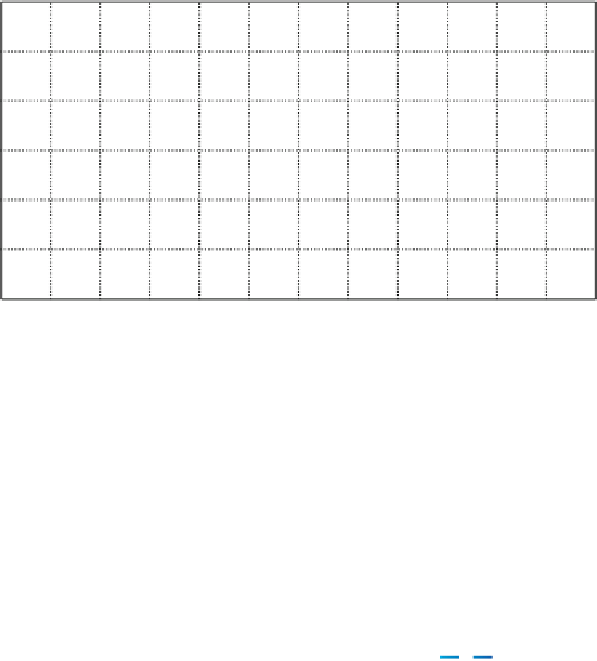
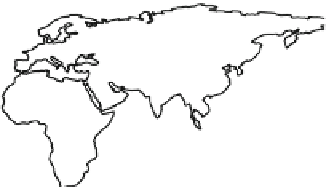
Fig. 4.8
Observation Influence (
OI
) of SYNOP and DRIBU surface pressure observations for
October 2011. High influential points are close to 1 and low influential points are close to 0
0.87
0.84
60°N
0.80
0.77
0.74
0.71
30°N
0.68
0.65
0.62
0.59
0°N
0.56
0.53
0.50
30°S
0.47
0.44
0.40
0.37
60°S
0.34
0.31
0.15
150°W
120°W
90°W
60°W
30°W
0°E
30°E
60°E
90°E
120°E
150°E
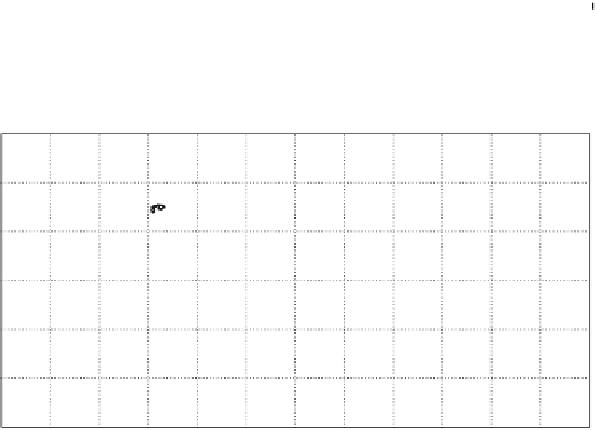
Fig. 4.9
Observation Influence (
OI
) of Aircraft zonal wind component above 400 hPa for October
2011. High influential points are close to 1 and low influential points are close to 0
also due to the evolution of the background-error covariance matrix as propagated
by the forecast model in 4D-Var (
Thepaut et al. 1993
,
1996
). As a result, the data
assimilation scheme can fit these observations more closely.
Similar features can be seen in Fig.
4.9
, which shows the influence of
u-component wind observations for Aircraft data above 400 hPa. Isolated flight
tracks over Atlantic and Pacific oceans show larger influences than measurements
over data-dense areas over America and Europe. The flight tracks over North
Atlantic and North Pacific are also in dynamically active areas where the
background error variances are implicitly inflated by the evolution of the
background-error covariance matrix in the 4D-Var window. Figure
4.10
shows
the geographical distribution of AMSU-A channel 8 observation influence. The
largest influence is noticed in the extra-tropics and polar areas (
0:4
) whilst in the


Search WWH ::

Custom Search