Geoscience Reference
In-Depth Information
(a)
100
Coal
UK
90
Wood
Coal
Oil
Gas
Renewable
Nuclear
80
70
60
50
40
Oil
30
Gas
20
Renewables
Nu
c
lear
10
Wood
0
1850
1870
1890
1910
1930
1950
1970
1990
2010
Year
(b)
100
US
90
Wood
Wood
Coal
Oil
Gas
Renewable
Nuclear
80
Coal
70
60
50
40
Oil
30
Gas
20
Nucle
a
r
10
Renewables
0
1850
1870
1890
1910
1930
1950
1970
1990
2010
Year
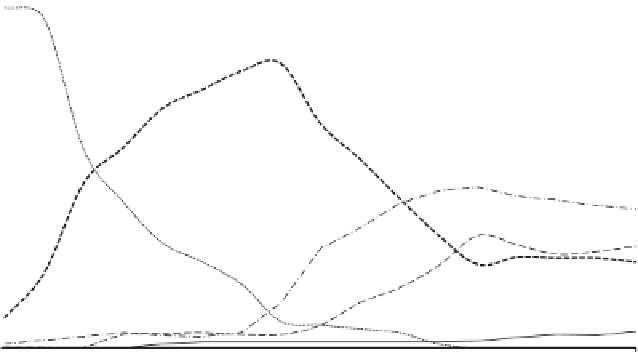
Fig. 7.8
Theproportionalcontribution(asapercentage)fromvariousfuelsmadetotheenergybudgetofthe(a)UK
and(b)USA.(c)Summaryoftheproportionalcontribution(percentage)fromvariousfuelstoglobalenergy
supply.Before1950theoreticalestimatesareusedandafter1950dataarebasedonestimatesderivedfrom
commercialigureswitha10-yearilter;seeAppendix3forsources.
1850. It can also be seen in other developed nations outside of Europe but with a
delayed start and hence in a contracted form. Figure 7.8b relates to the US energy
budget. We see that in the 20th century it took the order of three or four decades to
significantly develop a new fuel stream for a nation's energy budget. Such lead times
need to be considered when contemplating future energy resources.


Search WWH ::

Custom Search