Geoscience Reference
In-Depth Information
(a)
(b)
(c)
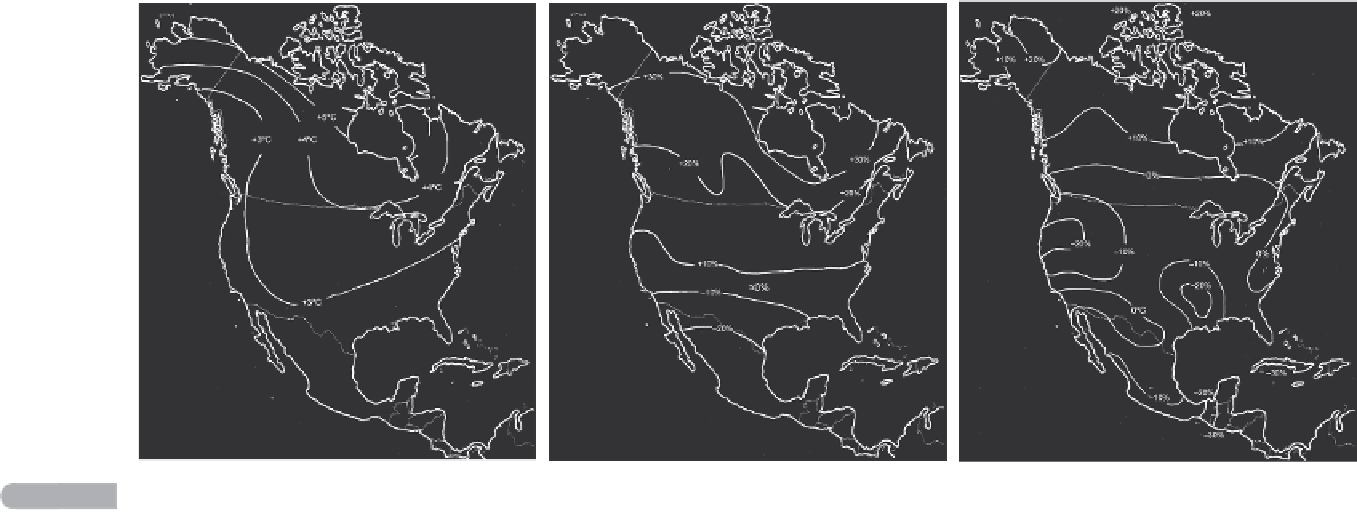
Fig. 6.6
Rough sketch maps of key aspects of North American climate change for the 21st century under B-a-U scenarios. (a) Mean annual temperature change over the 21st century. Everywhere in
NorthAmericawarms,withwarminggreaterathigherlatitudes.Thisdoesnotmeanitwillbewarmerthere,justthatthewarmingisgreaterthereoverthe21stcentury.(b)Changesinwinter
precipitation.
20%contoursareshown.North
ofthe0%changezoneincreasedsummerprecipitationisexpected.Again,notethat
change
inprecipitationismapped(notactualprecipitation).ThesouthwestandpartsofthewesternUSA
areexpectedtoseemuchgreaterdroughtthanatpresent.PartsofcentralNorthAmericaareexpectedtoseenetdryingcomparedtothepresent.EvenifprecipitationinpartsofNorthAmerica
remains the same at the end of the 21st century compared to the present, the warmer end-of-21st-century temperature will result in a dryer environment. Compare these sketch maps with
theIPCC2007assessment(WG1,chapter11)andtheUSGCRP2009report(sectiononnationalclimatechange).
−
20%,
−
10%,
+
10%,
+
20%and
+
30%contoursareshown.(c)Changesinsummerprecipitation.
−
30%,
−
20%
−
10%,0%,
+
10and
+
Search WWH ::

Custom Search