Geoscience Reference
In-Depth Information
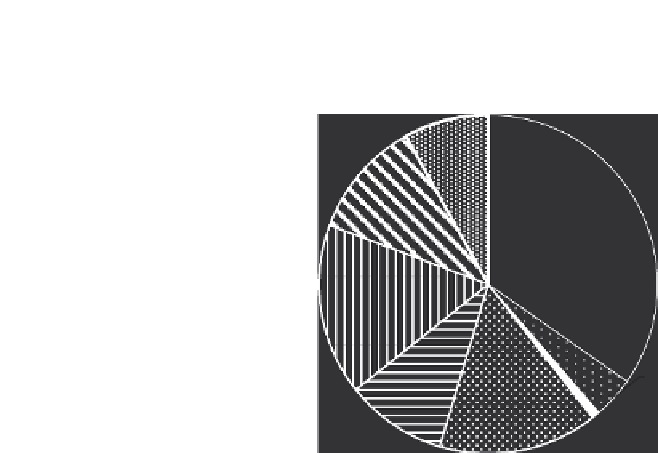
Biomass burning
8%
Rice fields
11%
Natural 40%
Anthropogenic 60%
Wetlands
35%
Ruminants
16%
Termites
4%
Hydrates
1%
Landfill
10%
Energy industries
15%
Fig. 5.11
Sourcesofatmosphericmethanefromthe1990sto2001.Seetextforexplanationandsource.
Kristal Verhulst, Eric Saltzman and colleagues looked at ethane. Ethane (C
2
H
6
) and
methane are the most abundant hydrocarbons in the atmosphere. However, ethane is
only associated with fossil fuels and biomass burning, not the other sources of meth-
ane. What the Aydin team did was to look at ethane in firn air (air trapped in perennial
snowpack) from Greenland and Antarctica to reconstruct the atmospheric variability
of ethane during the 20th century. They found that ethane levels rose from early in
the century until the 1980s, when the trend reversed, with a period of decline over
the next 20 years. They found that this variability was driven primarily by changes in
ethane emissions from fossil fuels; these emissions peaked in the 1960s and 1970s at
14-16 teragrams (Tg) year
−
1
10
12
1 megatonne [Mt]) and dropped to
8-10 Tg year
−
1
by the turn of the century. They concluded that reduction in fossil fuel
sources is probably related to changes in light hydrocarbon emissions associated with
petroleum production and use. The Aydin team suggest (in the main body of their
paper's text) that this decline in ethane might not relate so much to the co-release of
methane from 'petroleum production and use' (as stated in their paper's abstract) but
more to the venting of gas by petroleum refineries. Putting this quantitative inference
into a two-box atmospheric model, they estimated that the total decline in fossil fuel
emissions of ethane was 5-6 Tg year
−
1
(or Gt year
−
1
) during 1980-2000. Attributing
this decline entirely to decreases in fossil fuel emission sources implies a 15-30 Tg
year
−
1
drop in fossil fuel emissions of methane. This decline in fossil fuel methane
emissions during the 1990s accounts for less than 60% of the total reduction of atmo-
spheric methane observed during 1980-2000. This in turn raises the question of what
other methane emissions were declining.
The second 2011 paper was by Fuu Ming Kai, Stanley Tyler, James Randerson and
Donald Blake. They used synchronous time series of atmospheric methane mixing and
13
C/
12
C ratios in the northern and southern hemispheres and a two-box atmospheric
(1 Tg
=
g
=


Search WWH ::

Custom Search