Geoscience Reference
In-Depth Information
(a)
4
3
2
1
0
-1
1850
1900
1950
2000
2050
2100
Year
(b)
6
5
IPCC 2007
(A2)
4
IPCC 2001
3
2
IPCC 1990
1
IPCC 1995
0
1850
1
900
1950
2000
2050
2100
-1
Year
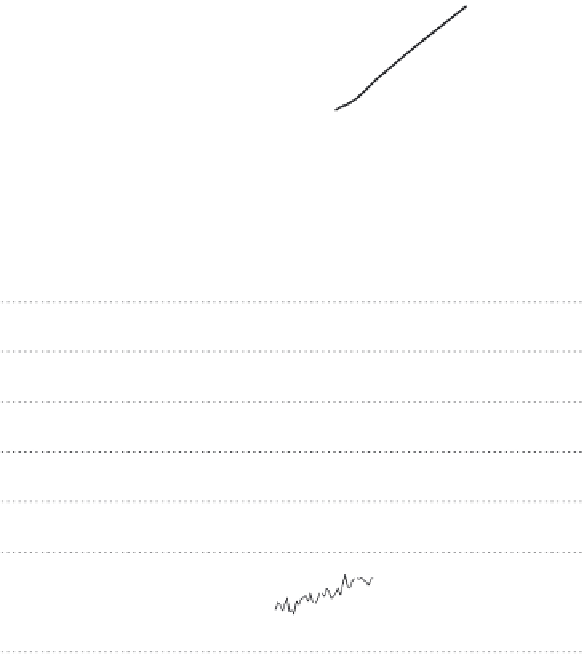
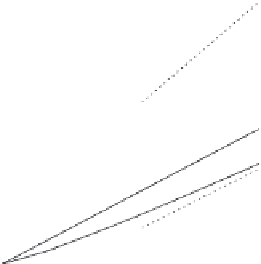
Fig. 5.8
(a)Globaltemperature(3-yearsmoothed)for1861-2002andIPCC1990B-a-Uscenarioforthe21stcentury,
relativetothe1961-90average.(b)Globaltemperature(3-yearsmoothed)for1850-2010actual
measurementsandthevarious'best-estimate'IPCCB-a-Uscenariosupto2100fromthe1990,1995,2001
(veryslightlysimpliied)and2007(boldline2000-2100undertheA2scenario)assessmentreports,butall
standardisedtoazerotemperatureequivalenttothe1961-90mean(thereferencetemperaturethatthe
UniversityofEastAnglia'sClimateResearchUnituses).Thedottedlinesbetween2050and2100aretheIPCC
1990B-a-U'high'and'low'estimates.NotethatthesubsequentIPCCB-a-Uanalogousbest-estimate
assessmentsareallbetweenthe1990B-a-Uhighandlowestimates(atestimonytotherobustnessofthe
IPCC's1990B-a-Uscenario).
Figure 5.8a is a 3-year-smoothed graph (as is the bold line in Figure 5.4) of
the global temperature since 1861 to 2002, with Figure 5.8a the IPCC 1990 B-a-U
forecast added from 1990 to the end of the 21st century. (The upper and lower limits
[that were in Figure 5.5] prior to 2050 have been removed leaving just the 'best
estimate' for the IPCC's 1990 Business-as-Usual scenario which remains a useful


Search WWH ::

Custom Search