Geoscience Reference
In-Depth Information
A1B
A1T
A1Fl
A2
B1
B2
IS92e high
IS92a
IS92c low
Several models
all SRES
envelope
Model ensemble
all SRES
envelope
5
4
(TAR method)
3
2
1
Bars show the
range in 2100
produced by
several models
0
2000
2020
2040
2060
2080
2100
Year
(b)
A2
6.0
A1B
B1
Year 2000 Constant
Concentrations
20th century
5.0
4.0
3.0
2.0
1.0
0.0
-1.0
1900
2000
Year
2100
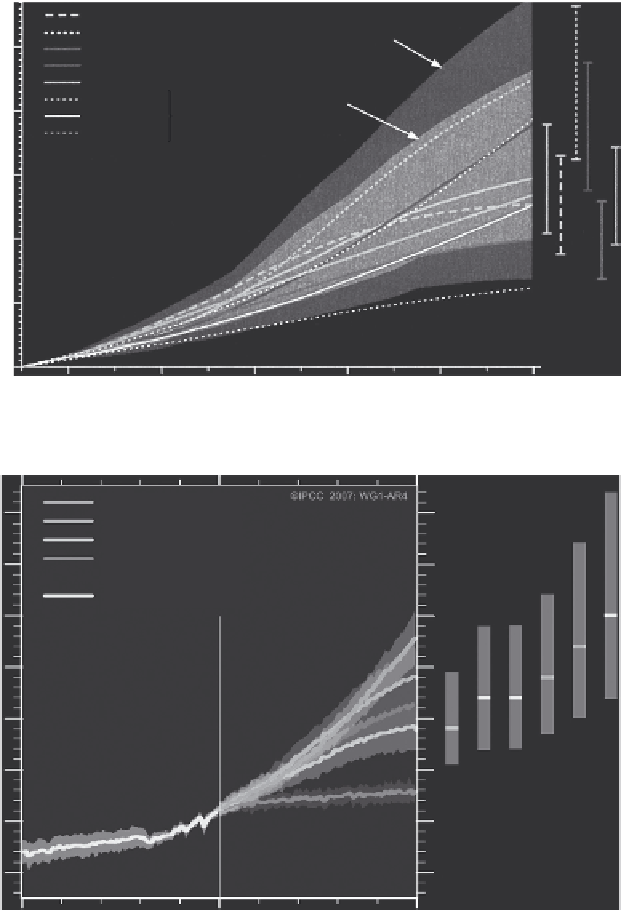
Fig. 5.7
(a)TheIPCC(2001b)allSpecialReportonEmissionScenario(SRES)temperature-changeforecasts,which
provideanenvelopeofpredicted21st-centuryglobalclimatechangerelativetothe
1990temperature
.
ReproducedwithpermissionoftheIPCC.TAR,IPCC2001thirdassessmentreport.(b)TheIPCC(2007)principal
scenariosforthe20thand21stcenturiesbasedontemperaturesrelativetothe
1980-99average
.Notethat
thelinecurvingupwardstoendatthehighestforecasttemperaturefor2100istheA2B-a-Uanalogous
scenario(ifwedonotsigniicantlyattempttocurbgreenhousegasemissions).Thelineleadingtothelowest
forecastrisefortheyear2100theIPCCincludeforpurelycomparisonpurposesasitisthescenarioinwhichthe
Earthmagicallyhasatmosphericgreenhousegasconcentrationsheldatwhattheywereintheyear2000;this
scenarioisofcourseimpossiblefantasybutshowsthatwhateverwedowewillnotescapeatleast0.6
◦
C
warmingby2100.ThisreproductionisofigureSPM.5from
ThePhysicalScienceBasis.WorkingGroupI
ContributiontotheFourthAssessmentReportoftheIntergovernmentalPanelonClimateChange
,Cambridge
UniversityPress,iswithpermission.

Search WWH ::

Custom Search