Geoscience Reference
In-Depth Information
0.6
0.4
0.2
0
1850
1870
1890
1910
1930
195
0
1970
1990
2010
-0.2
-0.4
-0.6
Year
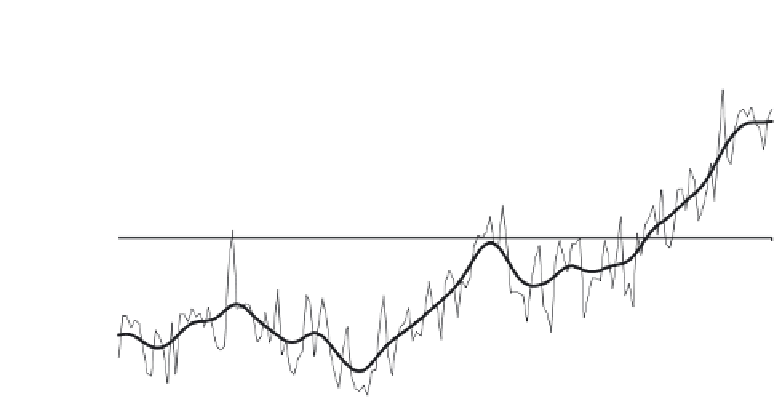
Fig. 5.4
Globaltemperaturebyyearandalsousinga3-year-smoothedilter,relativetothe1961-90averageand
coveringtheperiod1850-2010.ThedataforthisgraphwasoriginallycompiledjointlybytheClimatic
ResearchUnitandtheUKMeteorologicalOice,anddownloadedfromwww.cru.uea.ac.uk/cru/info/warming/
inJuly2011.
even some cooling occur at this time? The answer is that not only are there chaotic
meteorological vagaries but also the cycles of change in ocean circulation such as the
El Ni no are still continuing, as are changes in other forcing factors. Indeed in 2011
Robert Kaufmann, Heikki Kauppi, Michael Mann, and James Stock found, that the
1998-2008 hiatus in warming coincides with a period of little increase in the sum of
anthropogenic and natural climate forcings. There was a declining in solar insolation
as part of a normal 11-year cycle, and a cyclical change from an El Ni no to a La
Ni na dominate our measure of anthropogenic and rapid growth in reflective sulphur
emissions (driven by large increases in coal consumption in Asia in general, and
China in particular). Individually, each of these cooling factors would not have halted
the previous decade's warming trend, but together they did. Altogether these vagaries
can sometimes conspire to make current global warming seem to go away for a few
years. Actually this is only part of the story: the biosphere has probably continued to
warm, despite possibly receiving less heat and reflecting more. We need to remember
also that meteorological measurements that make up what we consider to be the
average temperature of the planet do not actually do this: such measurements are
an estimate of surface temperature. You will recall that heat entering the biosphere
is not confined to its surface. Some of it, on a very short-term (diurnal) basis, is
distributed throughout the atmosphere, and some of it absorbed by the oceans where
in the longer term it is transported both laterally and vertically. Computer models of
the biosphere by Gerald Meehl, Julie Arblaster and colleagues in 2011 show that,
in the years between 2005 and 2010, heat was drawn from the globe's surface into
the abyssal depths through downwelling currents and processes such as the Broecker
thermohaline circulation. Even so, the anthropogenic warming following the Little
Ice Age has been such that even if all the 'normal' vagaries in the various climate
forcing factors simultaneously happened to coincide in a cooling way, the Earth would


Search WWH ::

Custom Search