Geoscience Reference
In-Depth Information
21.6 Myr
50.9 Myr
4500
5000
5500
6000
6500
7000
7500
4500
5000
5500
6000
6500
7000
7500
0
0
500
500
1000
1000
30.8 Myr
79.3 Myr
4500
5000
5500
6000
6500
7000
7500
4500
5000
5500
6000
6500
7000
7500
0
0
500
500
1000
1000
39.0 Myr
107.9 Myr
4500
5000
5500
6000
6500
7000
7500
4500
5000
5500
6000
6500
7000
7500
0
0
500
500
1000
1000
H
2
O weight fraction
0.000 0.002 0.004 0.006 0.008 0.010
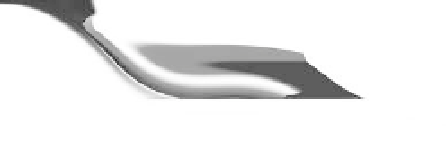
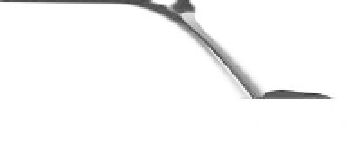
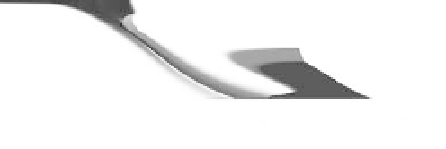
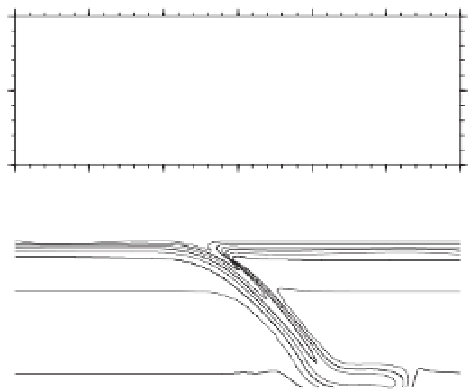
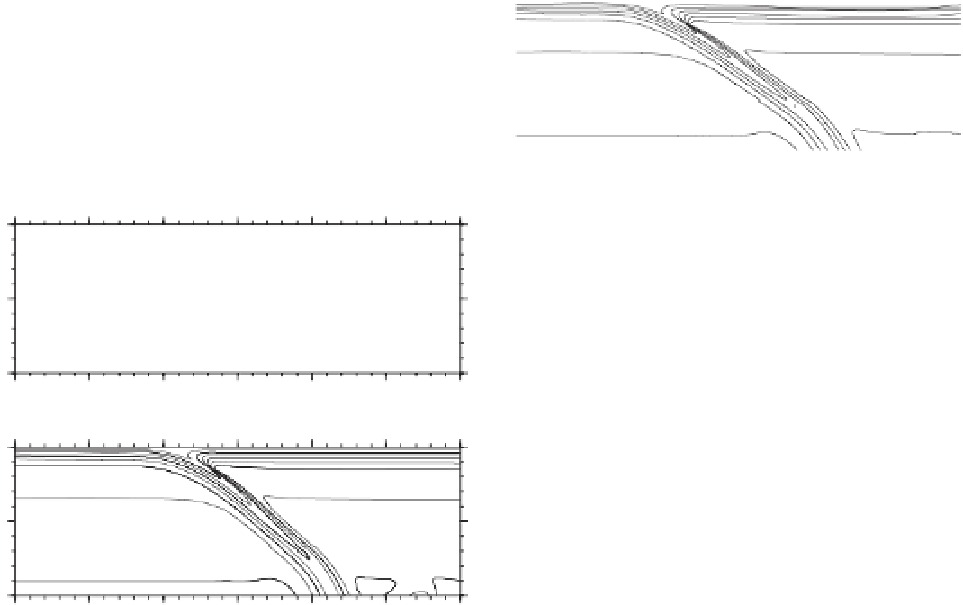
Fig. 13.7
Evolution of the subducted slab and its water transport when (
C
max
H
2
O
)ofthelowermantleisassumedtobe
0.001 wt %. The snapshots are taken at 21.6, 30.8, 39.0, 50.9, 79.3 and 107.9 millions of years. The gray scale and
the contour lines are the same as in Figure 13.6. The model parameters are the same as in Figure 13.6, except for
(
C
max
H
2
O
) of the lower mantle.
trench (process-3), and again dehydration occurs
when it enters the lower mantle (process-1). In
the case with
C
max
H
2
O
fluid if the temperature is high enough above the
second critical endpoint (
>
1000
◦
Cand
>
3.8 GPa,
Mibe
et al
., 2007). If such a fluid is denser than
the surrounding solid, water may be transported
into the lower mantle along with the descending
current. It should be stressed, however, that the
precise phase relations and the physical proper-
ties, including the density and viscosity of such a
fluid, needs to be constrained for the quantitative
estimate in future.
Figure 13.7 shows the case with
C
max
H
2
O
=
0.21 wt % (Figure 13.6), the
processes-1 to 3 repeat until the H
2
Ocontent
of the product in process-2 reduces to
C
max
H
2
O
of
the lower mantle, resulting in total H
2
Oab-
sorption by a wide hydrous current in the lower
mantle.
The fluid emitted during process-1, which is as-
sumed to be lighter and ascends upwards in this
study, may contain a significant amount of sili-
cate and/or oxide components as a supercritical
=
0.001
wt % (10 ppm). The water spreads again along