Geoscience Reference
In-Depth Information
21.6 Myr
40.7 Myr
4500
5000
5500
6000
6500
7000
7500
4500
5000
5500
6000
6500
7000
7500
0
0
500
500
1000
1000
30.8 Myr
84.1 Myr
4500
5000
5500
6000
6500
7000
7500
4500
5000
5500
6000
6500
7000
7500
0
0
500
500
1000
1000
H
2
O weight fraction
0.000 0.002 0.004 0.006 0.008 0.010
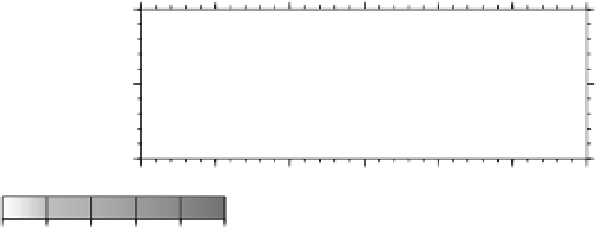
Fig. 13.6
Evolution of the subducted slab and its water transport when (
C
max
H
2
O
)ofthelowermantleisassumedtobe
0.21 wt %. The snapshots are taken at 21.6, 30.8, 40.7 and 84.1 millions of years. The gray scale shows the water
content in weight fraction (e.g., 0.010
1.0 wt %). The thin lines show the temperatures at 200, 600, 1000, and
1400
◦
C, and the thick lines for 400, 800, 1200, and 1600
◦
C. The model parameters are the same as those of Case 7
in Nakakuki
et al
. (2010) except for a longer elapse time (about 150 million years) of the simulation. We use an
extended Boussinesq fluid in a two-dimensional rectangular box with mechanically free-slip boundary condition.
The age of the subducting lithosphere is set at 100 Ma in the initial condition. Note that the age of the subducting
lithosphere is dynamically controlled as the plate motion varies. We consider Arrhenius-type temperature and
pressure dependence of the viscosity. History-dependent yield stress is introduced in order to generate plate-like
motion of the lithosphere with high viscosity. The buoyancy and rheological effects of olivine-series phase
transitions at 410-km and 660-km depths are incorporated into the model. The Clapeyron slopes of the 410-km and
660-km phase transitions are assumed to
=
2MPa K
−
1
and -2 MPa K
−
1
, respectively. Considering the effects of
grain-size reduction due to the 660-km phase transition, the viscosity of the slab in the lower mantle is reduced the
same value as that of the ambient mantle.
+
lithosphere and is assumed to contain 6 wt %
H
2
O (Schmidt & Poli, 1998). Only in the lower
mantle
C
max
layer, and transports
0.4 wt % H
2
O and reaches
660 km phase transition.
In both cases shown in Figures 13.6 and 13.7,
C
max
∼
H
2
O
is varied as a model parameter. Af-
ter the basalt layer is dehydrated, the wedge-side
mantle that is contacted to the subducted oceanic
crust (i.e., HBL) transports the water. This layer
in the wedge mantle behaves as a part of the sub-
ducted slab because thermal diffusion cools it so
that its viscosity becomes much higher than the
ambient wedge mantle (see the temperature con-
tour lines in Figures 13.6 and 13.7). Therefore the
HBL constitutes a material and thermal boundary
H
2
O
of the lower mantle is lower than that
contained in the HBL. Therefore, dehydration
occurs to produce upward fluid flow when the
subducting slab drags the HBL slightly below
the 660 km phase transition (process-1). The
emitted water then hydrates a thin segment in
the overlying transition zone mantle (process-2).
The hydrated segment is dragged down with a
horizontal velocity component away from the