Geoscience Reference
In-Depth Information
dln Vs [%]
950 km (
+
/
−
0.82)
dln rho [%]
950 km (
+
/
−
1.1)
1000
1200
1400
1600
1800
2000
2200
2400
2600
2800
3000
1500 km (
+
/
−
0.85)
1550 km (
+
/
−
1.0)
2600 km (
+
/
−
0.95)
2600 km (
+
/
−
1.0)
dln v
s
dln
ρ
dln v
s
dln v
p
dln v
s
dln v
c
2891 km (
+
/
−
1.0)
2891 km (
+
/
−
0.99)
1
0.8
0.6
0.4
0.2
0
0.2
0.4
0.6
0.8
1
Correlation
0
−
1.8
0.0
1.8
−
1.8
0.0
1.8
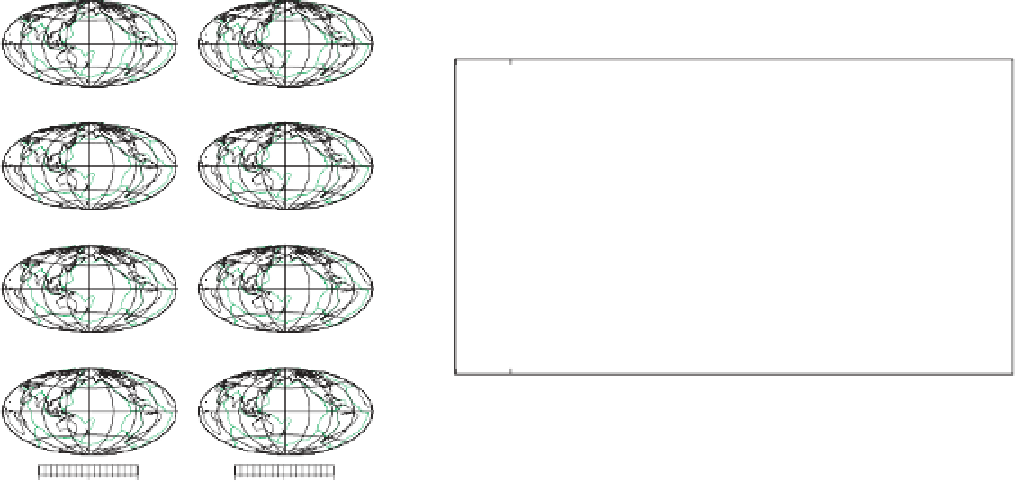
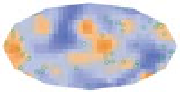
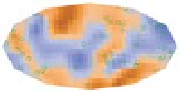
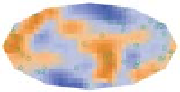
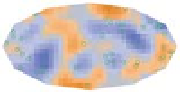
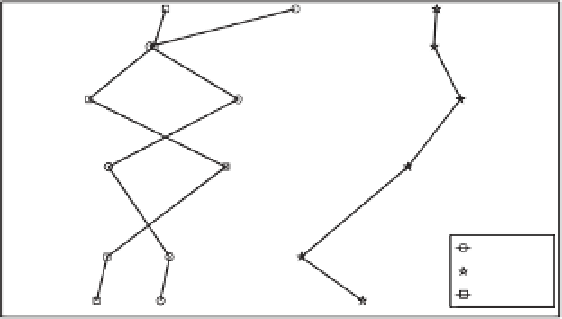
Fig. 11.5
Left: Lateral variations in
v
s
and
ρ
at various depths in the maximum-likelihood model of Mosca
et al.
2012. The laterally averaged standard deviations are indicated in brackets. Note the pronounced anti-correlation of
d
ln
v
s
and
d
ln
ρ
around 2600 km depth beneath the central Pacific and Africa. (See Color Plate 12). Right:
Correlation coefficients as a function of depth between the most likely models of
d
ln
v
s
,
d
ln
ρ
,
d
ln
v
p
and
d
ln
v
c
,where
v
c
denotes the bulk sound velocity. Figure modified after Mosca
et al.
2012.
Recently, the studies on probabilistic tomog-
raphy were extended by Mosca
et al.
(2012)
who incorporated improved splitting function
measurements, as well as a large collection of
body wave travel times (figure 11.5).
In the light of the weak constraints, it is not
surprising that widely accepted seismological in-
ferences on the Earth's density structure are rel-
atively few in number. That subducting slabs
and ascending plumes in the uppermost mantle
are comparatively dense or light, respectively,
follows from geodynamic arguments, but un-
equivocal seismic evidence on length scales above
degree 6 is missing.
The most reliable results concern the corre-
lation between velocity and density structure
at degrees 2, 4 and 6. In the mid-mantle, be-
tween 660 and around 1800 km depth,
d
ln
v
s
and
d
ln
ρ
are most likely to be uncorrelated.
Within the lower mantle, seismic data prefer a
mild anti-correlation of
d
ln
v
s
and
d
ln
ρ
,with
a correlation coefficient around
0.4 (see Figure
11.5). The only concrete structural inference re-
lates to the presence of high-density material in
the lowermost mantle beneath the African and
Pacific superplumes that has been found consis-
tently by several independent studies (e.g. Ishii
& Tromp, 2001, 2004), Trampert
et al.
, 2004;
Simmons
et al.
, 2010; Mosca
et al.
, 2012). All of
these results must be interpreted with caution,
given the relatively large standard deviations that
range around 50% of the maximum relative den-
sity perturbations, even when large data sets of
surface waves, normal modes and body waves are
combined.
Finally, we note that robust seismic informa-
tion on the density in the upper mantle is so far
missing. This is because structure above 660 km
depth cannot be adequately described in terms of
the lowest-degree spherical harmonics that we are
−