Geoscience Reference
In-Depth Information
mantle temperature and geodynamics. Some of
the variationmight be due to different corrections
for mantle velocity structure in these models,
which may trade-off with discontinuity depths.
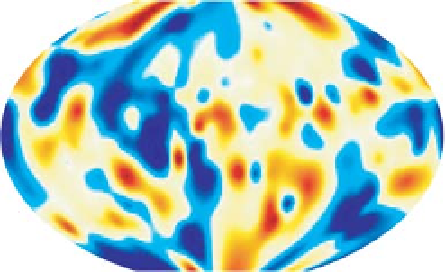
An example of a SS precursor map is shown in
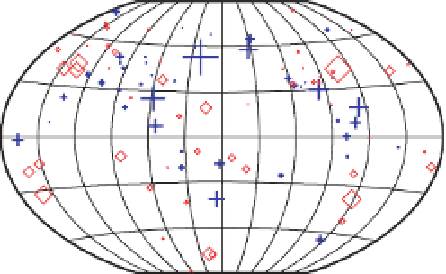
Figure 10.7a, with a receiver function map in
Figure 10.7b; both maps are corrected for mantle
velocity structure using S20RTS (Ritsema
et al
.,
1999). As the receiver functions don't have full
global coverage and show much stronger regional
variation than the SS precursors, the receiver
functionmap has not been smoothed or contoured
as was done for the SS precursor map.
One of the main differences between the two
maps is the average transition zone thickness,
which is around 250 km for the receiver func-
tions, and 242 km for the SS precursors (e.g.
Chevrot
et al
., 1999). The difference might be
due to different regional sampling, or may reflect
sensitivity to different structure in the mantle
transition zone. Interestingly, two SS precursor
studies have argued that the transition zone
thickness is 6-8 km thicker under continents
than under oceans (Gossler & Kind, 1996; Gu
& Dziewonski, 2002). As Pds receiver function
predominantly sample the continental areas, the
SS precursors might actually be in agreement
with the receiver functions. The remaining
question is then if there is a tectonic reason
for the continents having a thicker transition
zone than the oceans. Looking at Figure 10.7 it
seems that many of the subduction zone areas
in the ring around the Pacific are on the edge
of continental regions. So, it seems more likely
that the continent-ocean difference is just a
coincidence due to uneven distribution of the
subduction regions with thick transition zone.
Even though the average thickness may be dif-
ferent between the SS precursors and receiver
functions, the regional patterns of the two maps
shows some agreement. The subduction zone
regions around the western and northern rim
of the Pacific show a thickened transition zone
in both the SS precursors and the Pds receiver
functions. The middle of the Pacific shows pre-
dominantly a thinner transition zone. There is
less agreement between the two data types in
the southern hemisphere, especially around the
Antarctic and South America, but these are also
the regions where the SS precursor data coverage
is the poorest so the transition zone thickness
will be less reliable.
According to the predictions for olivine
phase transitions, a thicker transition zone is
SS precursors
Pds receiver functio
n
s
216
224
232
240
248
256
264
210
230
250
270
290
TZ thickness (km)
TZ thickness (km)
(a)
(b)
Fig. 10.7
Transition zone topography maps using (a) SS precursors (Deuss, 2009). Reproduced with permission of
Springer and (b) Pds receiver functions (Andrews & Deuss, 2008). Reproduced with permission of the American
Geophysical Union. (See Color Plate 10).