Geoscience Reference
In-Depth Information
changes are called discontinuities and they can
be studied using seismic body waves which are
reflected, converted or refracted at these bound-
aries. In this chapter, we will focus on the seismic
observations of discontinuities in the mantle, and
their mineralogical and dynamical interpretation.
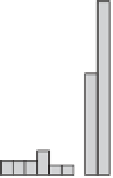
During the last century, there have been
suggestions for discontinuities at almost any
depth in the mantle (see Figure 10.1). The main
boundaries appear at 410 and 660 km depth
(also called the '410' and the '660'), which
marks the transition zone between the upper
and lower mantle (e.g. Shearer, 2000; Helffrich,
2000). An additional discontinuity is found at
520 km depth (the '520') in the middle of the
transition zone (Shearer, 1991, 1996; Deuss &
Woodhouse, 2001). Research has been dominated
by the transition zone discontinuities at 410,
520 and 660 km depth. Smaller discontinuities
are sometimes seen at other depths in the upper
and lower mantle, most notably the Lehmann
discontinuity at 220 km (Lehmann, 1959, 1961)
and the X-discontinuity at around 300 km
(Revenaugh & Jordan, 1991b). In addition several
discontinuities in the lower mantle have been
found, but these may be scatterers rather than
discontinuities. Of the smaller discontinuities,
only the Lehmann discontinuity at 220 km
depth stands out in Figure 10.1, suggesting that
this discontinuity may be existing in more
than one region, though not globally as it does
appear less frequent than the transition zone
discontinuities.
Most of the seismologically observed dis-
continuities represent known phase transitions
in mantle minerals - i.e. changes in crystal
structure under conditions of increasing pressure
and temperature with depth (e.g. Ringwood,
1975). One of the interesting reasons for studying
seismic discontinuities is that they form a direct
link with mineralogical phase transitions (Ita &
Stixrude, 1992). Whenever a new discontinuity is
discovered in seismology, we need a mineralog-
ical explanation for it. Vice versa, whenever new
phase transitions are discovered, seismologists
can actively search for its characteristics in
their data. Seismic properties, like the depth,
topography, magnitude and spatial variation of
Upper mantle
Transition zone
Lower mantle
60
660
50
410
40
30
520
20
220
10
0
200
300
400
500
600
700
800
900
1000
1100
1200
1300
depth(km)
Fig. 10.1
Histogram of the number of papers which cite a seismological observation of a discontinuity at a
certain depth. This figure is an updated version of a similar figure in Shearer (2000), extended to include the upper
mantle and part of the lower mantle and including all publications from 1961 until 2011 in the reference list of
this chapter.