Geoscience Reference
In-Depth Information
analysis (Rossman, 2006). Approximate numbers
for water contents may also be obtained using
empirical correlations between extinction coeffi-
cients and OH stretching frequencies (Paterson,
1982; Libowitzky & Rossman, 1997). Only in
recent years has secondary ion mass spectrome-
try (SIMS) been developed sufficiently to be used
to routinely measure water contents in minerals
down to the ppm level (e.g. Koga
et al
., 2003;
Mosenfelder
et al
., 2011). Unlike infrared spec-
troscopy, however, SIMS measurements do not
yield any information on water speciation and,
as such, they cannot directly distinguish between
OH groups in the crystal lattice and mechanical
impurities, such as water on grain boundaries,
dislocations or fluid inclusions.
The recognition that nearly all nominally an-
hydrous minerals from the upper mantle contain
traces of water (e.g. Bell & Rossman, 1992; Miller
et al
., 1987; Matsyuk & Langer, 2004) has stimu-
lated experimental studies of water solubility in
these minerals. The suggestion by Smyth (1987)
that wadsleyite could be a major host of water in
the transition zone of the mantle, capable of stor-
ing several ocean volumes of water has further
stimulated this work and it is now generally ac-
cepted that most of the water in the mantle occurs
as OH point defects in nominally anhydrous min-
erals. Hydrous minerals, fluids or water-bearing
silicate melts only form under special circum-
stances and at specific locations in the mantle.
While the absolute concentrations of water in
mantle minerals are low, due to the very large
mass of the Earth's mantle they constitute a wa-
ter reservoir probably comparable in size to the
oceans, with a potential storage capacity several
times larger than the ocean mass. In other words,
most parts of the upper mantle are undersatu-
rated with water, so that the actual OH contents
in minerals are far below their saturation level.
Water is dissolved in silicates by protonation
of oxygen atoms, charge balanced by Mg
2
+
vacan-
cies, Si
4
+
vacancies and by coupled substitutions,
such as Al
3
+
+
8
6
4
(001)
2
(100)
(010)
0
4000
3800
3600
3400
3200
3000
2800
Wavenumber (cm
−
1
)
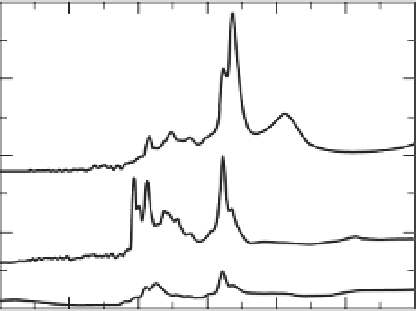
Fig. 1.2
Polarized infrared spectra of a
water-containing olivine. The figure shows three
spectra measured with the electrical field vector
parallel to the a, b, and c axis of the crystal. Spectra
courtesy of Xiaozhi Yang.
concentrations down to the ppb level, if suf-
ficiently large single crystals are available. In
principle, quantitative water contents can also
be measured using the Lambert Beer law
E
=
log
I
0
/I
=
ε cd
,
(1.1)
where
E
is extinction or absorbance,
I
0
is in-
frared intensity before the sample,
I
is infrared
intensity after the sample,
ε
is the extinction
coefficient,
c
is concentration (of water) and
d
is sample thickness. Therefore, if the extinc-
tion coefficient of water in a mineral is known,
water contents down to the ppb level can be
accurately determined by a simple infrared mea-
surement. Unfortunately,
ε
varies by orders of
magnitude from mineral to mineral and
ε
may
even be different for the same mineral, if OH
groups are incorporated on different sites or by a
different substitution mechanism, which results
in a different type of infrared spectrum. Extinc-
tion coefficients therefore have to be calibrated
for individual minerals by comparison with an
independent and absolute measure of water con-
centration, such as water extraction combined
with hydrogen manometry or nuclear reaction
for Si
4
+
or Al
3
+
+
H
+
for
2Mg
2
+
. Evidence for these substitution mech-
anisms comes from infrared spectra and from
experimental observations. For example, certain
H
+