Geoscience Reference
In-Depth Information
and velocity of molten iron-light-element alloy
systems. There are two ways to measure the
density of the materials forming the liquid core
under static high pressure conditions. One is the
X-ray absorption method, and the other is the
sink-float method using density markers.
The X-ray absorption method has been in-
troduced by Katayama
et al
. (1993) to measure
the density of various metallic liquids at high
pressure. This method is based on the Lambert-
Beer law:
Absorption Profile
In(I/I
0
)
I
0
I
ion chamber
ion chamber
Si (111)
SPring
−
8
BL22XU
slits
50
×
50
μ
m
DIA-type cubic
anvil apparatus
(SMAP-1)
I
=
I
0
e
−
μρ t
where
I
0
is the incident X-ray intensity,
I
is the
intensity of the passed X-ray,
μ
is theX-ray mass
absorption coefficient, and
t
is the sample thick-
ness. When we know the X-ray mass absorption
coefficients and the sample thickness, we can
determine the density of the sample precisely.
A monochromatic X-ray is used for the X-ray
source, and large volume presses are used for
the measurements. Katayama
et al
. (1993) used a
DIA-type cubic apparatus, whereas Sanloup
et al
.
(2000) used the Paris-Edinburgh cell (a Troid-type
cell designed for neutron diffraction) to measure
X-ray absorption. To measure the intensity ratio
of the incident and transmitted X-rays, Katayama
et al
. (1993) used two ion-chambers placed in the
front and in the back of the press, whereas San-
loup
et al
. (2000), Chen
et al
. (2005), and Terasaki
et al
. (2010) used the X-ray radiographic imaging
to determine of the absorption profile. Figure 8.12
shows an example of the experimental setup for
the X-ray absorption method using the DIA cu-
bic press with two ion chambers. In this setup,
the press with the sample cell assembly moves
horizontally perpendicular to the X-ray beam.
Another procedure for determination of the
density of the melt is the sink-float method,
which was used by Kushiro (1978), Agee and
Walker (1988), and Ohtani
et al
. (1993) for sili-
cate melts and by Balog
et al
. (2001) and Nishida
et al
. (2008) for metallic Fe-S melts. When we
know the equation of state of the density marker
precisely, we can bracket the bound of the density
of the melt by observation of sinking or floating
of the standard material at high pressure and
temperature. Composite density markers (inner
Fig. 8.12
The experimental setup for the X-ray
absorption method at the beamline BL22XU of
Spring-8. A monochromatized X-ray is introduced to
the DIA type cubic press. Two ion chambers are used
for the measurement of intensities of an incident X-ray
(
I
0
) and a passed X-ray (
I
). Reproduced with permission
of Elsevier.
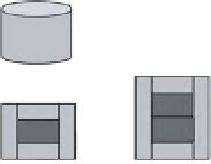
Pt
Al
2
O
3
Al
2
O
3
1,34 mm
1 mm
Pt
Fig. 8.13
An example of the density marker composed
of the outer alumina tube with alumina caps, and a Pt
rod in the center (Tateyama
et al
., 2011).
core:W or Pt, outer shell: corundum) were used
by Balog
et al
. (2001). Similarly, a cylindrical com-
posite density marker was used by Nishida
et al
.
(2008) to determine the density of the metallic
melt. They introduced in situ X-ray radiographic
imaging to observe floating and sinking of the
density marker. Figure 8.13 is an example of the
density marker composed of the outer alumina
tube with alumina caps, and a Pt rod in the center.
Figure 8.14 is an X-ray radiographic image, which
shows floating of the sample at high pressure and
temperature (Tateyama
et al
., 2011).
(b) Physical properties of Fe-S, Fe-Si, and Fe-C
melts at high pressure
Figure 8.15 shows the