Geoscience Reference
In-Depth Information
are plotted in Figure 7.12, which indicates slightly
positive
ln
V
P
(mostly less than
1%), so that
the pyrolitic and MORB composites are almost
indistinguishable in
V
P
. In contrast, the MORB
composite has the distinctly slower S velocity
by
+
14
V
P
12
−
1% to
−
3% in particular in the pressure
range
30-40 GPa and
>
120 GPa. The former
is due to the elastic shear instability of St abun-
dant in the MORB composite, while the latter
is related to a suppression of the effect of the
PPv transition in MORB with the smaller frac-
tion of MgPv and the effects of large iron and
aluminum incorporations (Tsuchiya & Tsuchiya,
2006) and to the negative velocity jump across
the CaCl
2
-
α
-PbO
2
transition in SiO
2
(Karki
et al
.,
1997a) compensating for the PPv velocity change.
Therefore, the blobs with the MORB compo-
sition might produce some seismic signatures
in the mid-lower mantle region as suggested
previously based on the elasticity only of the
single phase of silica (Kaneshima & Helffrich,
1999; Vinnik
et al
., 2001; Tsuchiya
et al
., 2004c;
Lakshtanov
et al
., 2007). Although the thermal
effects on density and elasticity in MgPv and PPv
were applied to the entire composites, similar
thermal expansivities of dense minerals under
high pressure (e.g., Irifune & Tsuchiya, 2007)
strongly suggest that this treatment produces
marginal errors.
Seismological tomographic investigations dem-
onstrate substantial lateral velocity hetero-
geneities both in
V
P
(e.g., Zhao, 2004) and
V
S
(e.g., Grand
et al
., 1997; M egnin & Romanowicz,
2000; Antolik
et al
., 2003; Takeuchi, 2007) in the
deepest mantle region. Although these hetero-
geneities are thought to be produced by thermal
and/or compositional anomalies, which likely
develop in the boundary layer (Hoffman 1997;
Trampert
et al
., 2004; Nakagawa & Tackley,
2005; Bull
et al
., 2009; Lassak
et al
., 2010),
a recent seismological and mineral physical
joint modeling suggests that these are mostly
explained by a lateral temperature variation
within 200 to 300 K (Kawai & Tsuchiya, 2009).
Indeed, the small
V
P
contrast (
<
1%) calculated
between the pyrolitic and MORB composites
(Figure
∼
10
V
Φ
8
6
V
S
4
0
50
100
150
P (GPa)
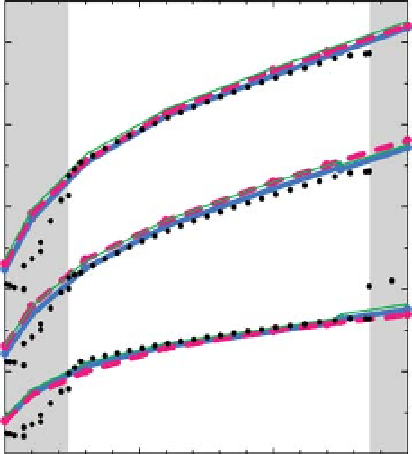
Fig. 7.11
Seismic velocity profiles for pyrolite (solid
blue line), MORB (dashed pink line), and perovskitite
(thin green line) calculated along the Brown and
Shankland's geotherm with the reference Earth value
(black dots) (Dziewonski & Anderson, 1981).
Computational uncertainties were found comparable
to the thickness of the lines. (See Color Plate 4).
12 mol% FeSiO
3
) are also shown in Figures 7.10
and 7.11, demonstrating that the
V
S
of perovski-
tite are even comparable to that of pyrolite, but
density,
V
P
and
V
of perovskitite, which are not
constrained in the analysis of Murakami (2011),
are clearly too high compared to those of py-
rolite and also the PREM values. On the other
hand, small but clear overestimations can still
be seen in
V
even for pyrolite above
100 GPa.
To compensate this gap, more Fp-rich bulk com-
positions are required as a recent experimental
analysis (Tange
et al
., 2012), but such compo-
sitions should provide poor agreements in other
properties, in particular substantial underestima-
tions in
V
P
and
V
S
.
For more detailed analyses, velocity contrasts
defined as
∼
2(
V
MORB
−
V
Pyrolite
)
ln
V
≡
(7.10)
7.12)
demonstrates
that
the
velocity
V
MORB
+
V
Pyrolite